Volatility Trading Strategies for Beginners
- Live Trading
- Learning Track
- Prerequisites
- Syllabus
- About author
- Testimonials
- Faqs
Learn Volatility Trading Strategies
- Measure volatility using ATR, implement dynamic stop loss and compare the strategy performance with the fixed stop loss approach.
- Define the standard deviation of a stock and implement it in a trading strategy.
- Explain Bollinger bands, the different phases of Bollinger bands and create strategies to identify and trade trends.
- Explain VIX, describe the properties of VIX and list the VIX derivatives.
- Implement portfolio hedging, selectively long strategy using VIX and VIX spread strategy.
- Define beta, describe the CAPM model, and research and backtest a portfolio of stocks selected on the basis of beta.
- Paper/live trade, analyse your strategies and assimilate your learnings with a capstone project.

Skills Required for Volatility Trading
Strategies
- ATR
- Bollinger Bands
- Breakout
- Portfolio hedging using VIX
- Betting against Beta
Concepts & Trading
- Moving average & moving standard deviation
- Volatility Index
- True Range
- Beta
- VIX Derivatives
Python
- Pandas
- Numpy
- Matplotlib
- Ta-lib
- Seaborn

learning track 1
This course is a part of the Learning Track: Algorithmic Trading for Beginners
Course Fees
Full Learning Track
These courses are specially curated to help you with end-to-end learning of the subject.
Course Features
- Community
Faculty Support on Community
- Interactive Coding Exercises
Interactive Coding Practice
- Capstone Project
Capstone Project Using Real Market Data
- Trade & Learn Together
Trade and Learn Together
- Get Certified
Get Certified
Prerequisites for Volatility Trading
To start with the course, you need to have a basic understanding of the financial market. You should also be aware of some trading related terminologies such as long, short, stop-loss, profit target, etc. A hands-on experience in using trading platforms is recommended. Familiarity in using python would be an added advantage.
Volatility Trading Strategies Course
- IntroductionLearn the application and effectiveness of volatility based trading strategies. You will be guided through the course structure and the various concepts covered in this course. Also, you can explore the various features that are available to you on Quantra.
Entry Signals
In this section, you will learn about the moving average crossover strategy. You will learn to generate entry signals using moving average crossover.Section Overview3m 8sMoving Average Crossover4m 17sFeatures of Moving Average2mCalculate Moving Average2mHow to Use Jupyter Notebook?1m 54sDetermine the Entry Points10mGetting Started5mEntry Signals2mCalculate SMA5m- Fixed SL & TPExiting using fixed stop-loss and fixed take profit is the simplest way of exiting an open position. In this section, you will learn how to implement the same in python.Exit Using Fixed Stop-Loss and Take Profit10mCalculate Fixed Stop-Loss5mCalculate the Trading Cost5m
ATR
In this section, you will learn about a volatility based indicator called The Average True Range (ATR). You will learn to calculate the True Range and Average True Range to measure stock volatility.Measuring Volatility using ATR2mDays Range2mProperties of True Range2mCalculate True Range2mATR Indicator2mCalculate ATR2mThe Magnitude of ATR2mAdditional Reading for ATR10mSL & TP using ATR
In this section, you will learn how ATR can be used to determine the exits. Calculating stop-loss and take profit prices will be explained with examples.ATR to Determine Exits4m 44sLimitation of Fixed Percentage Approach2mATR Value2mATR for Exits2mPossible Range2mBenefits of Dynamic Exits2mDetermine Stop-loss2mReset Stop-loss2mExit Using ATR10mCalculate ATR for a Stock5mDynamic Stop-Loss5mComparison Between Fixed and Dynamic Approaches10mLimitations of ATR10mCompare ATR Values2mVolatility and Price Change2mCompare Volatility2mAdditional Reading for SL & TP using ATR10m- Live Trading on BlueshiftThis section will walk you through the steps involved in taking your trading strategy live. You will learn about the backtesting and the live trading platform, Blueshift. You will learn about code structure, various functions used to create a strategy and finally, paper or live trade on Blueshift.Uninterrupted Learning Journey with Quantra2mSection Overview2m 19sLive Trading Overview2mVectorised vs Event Driven2mProcess in Live Trading2mReal-Time Data Source2mBlueshift Code Structure2m 57sImportant API Methods10mSchedule Strategy Logic2mFetch Historical Data2mPlace Orders2mBacktest and Live Trade on Blueshift4m 5sAdditional Reading10mBlueshift Data FAQs10m
Live Trading Template
This section includes a template of a trading strategy that can be used on Blueshift. This live trading strategy template uses moving average crossover for entry signals and ATR for exit signals. You can tweak the code by changing securities or the strategy parameters. You can also analyse the strategy performance in more detail.- Measuring Volatility Using Standard DeviationThis section introduces you to the concept of standard deviation. You will learn to calculate standard deviation and use standard deviation to measure stock volatility.Standard Deviation2m 41sIntuition of Standard Deviation2mComparing Standard Deviation2mMeasuring Volatility2mCalculation of Standard Deviation2m 5sCalculate Standard Deviation of a Stock5mStandard Deviation Formula2mVariables of Standard Deviation Formula2mMean and Standard Deviation2mAdditional Reading on Standard Deviation10m
- Applications of Standard Deviation In TradingIn this section, you will learn the applications of standard deviation in trading. Calculating trading range and deciding exit parameters using the volatility will be explained with examples.How to Use Standard Deviation In Trading?3m 6sStandard Deviation of a Stock2mTrade Parameters Using Standard Deviation2mVolatility Based Stop Loss2mTest on Volatility and Standard Deviation14m
Bollinger Bands
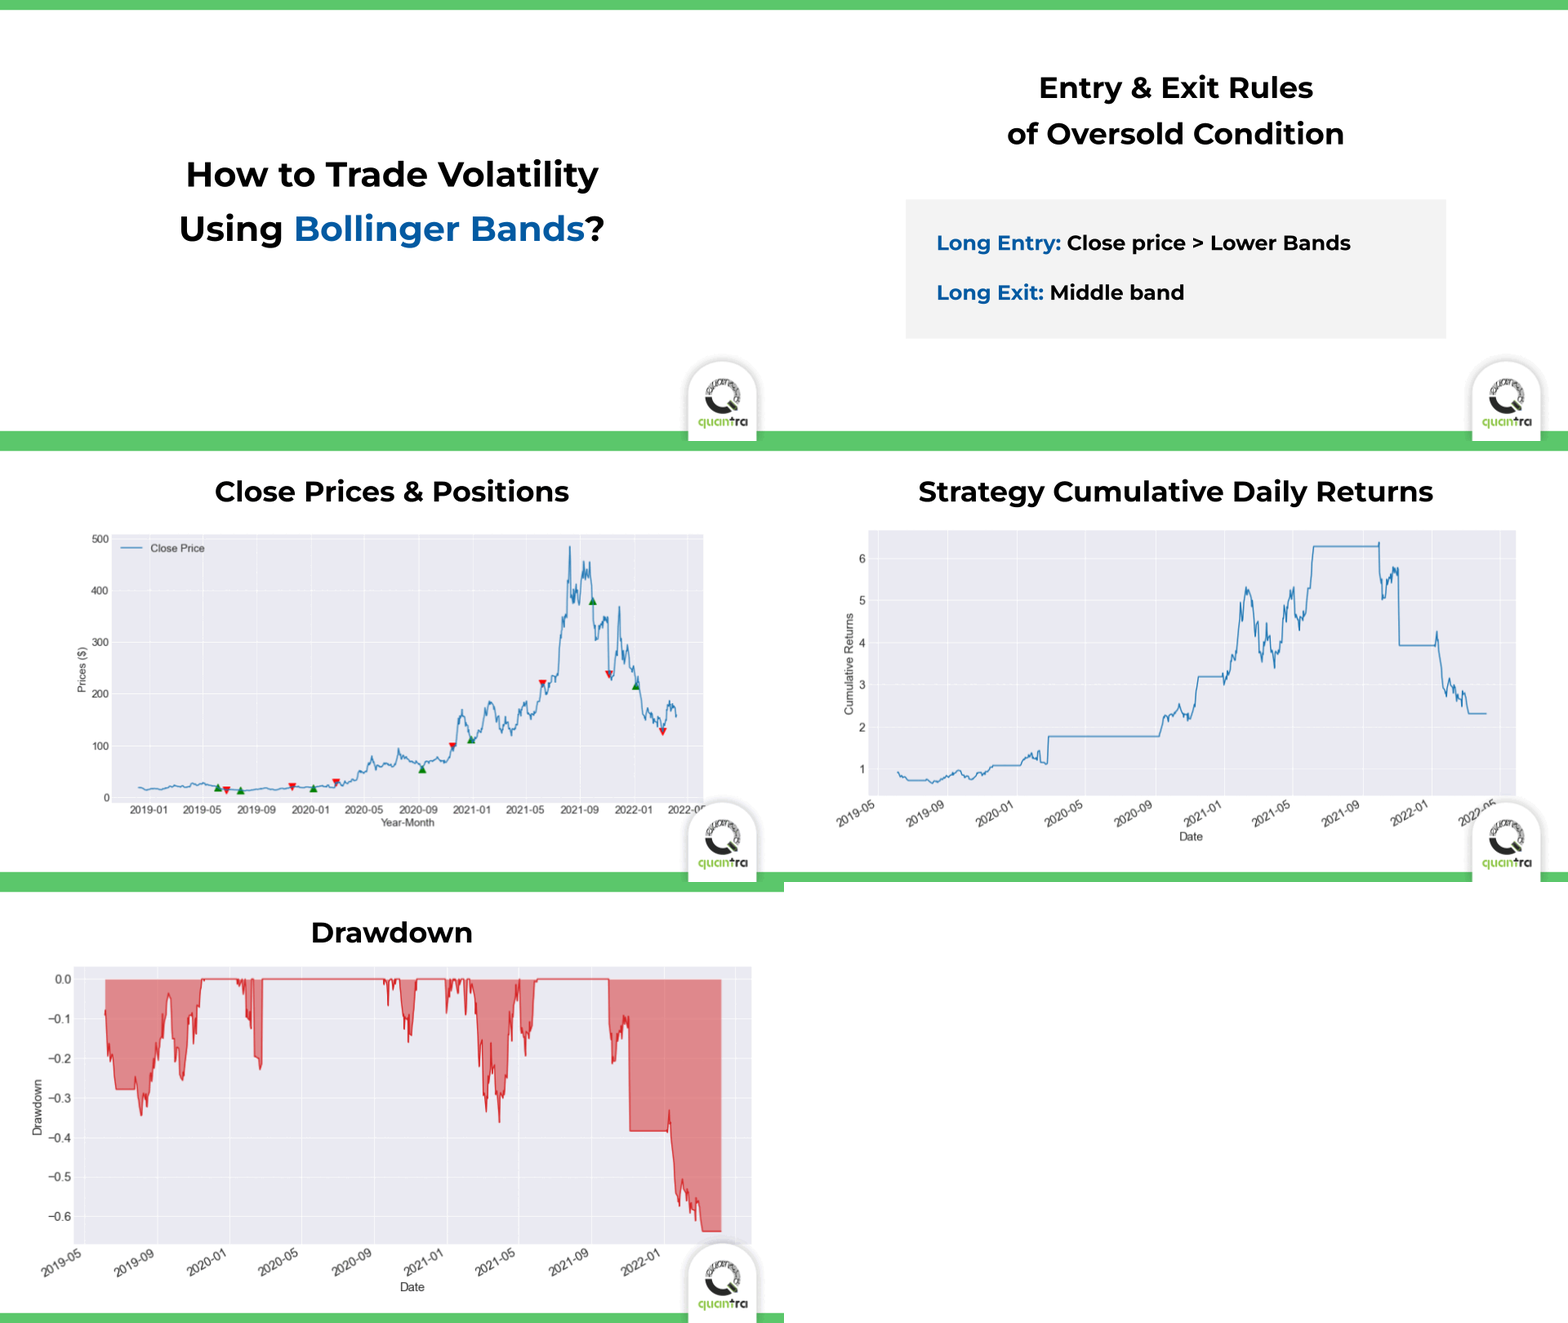
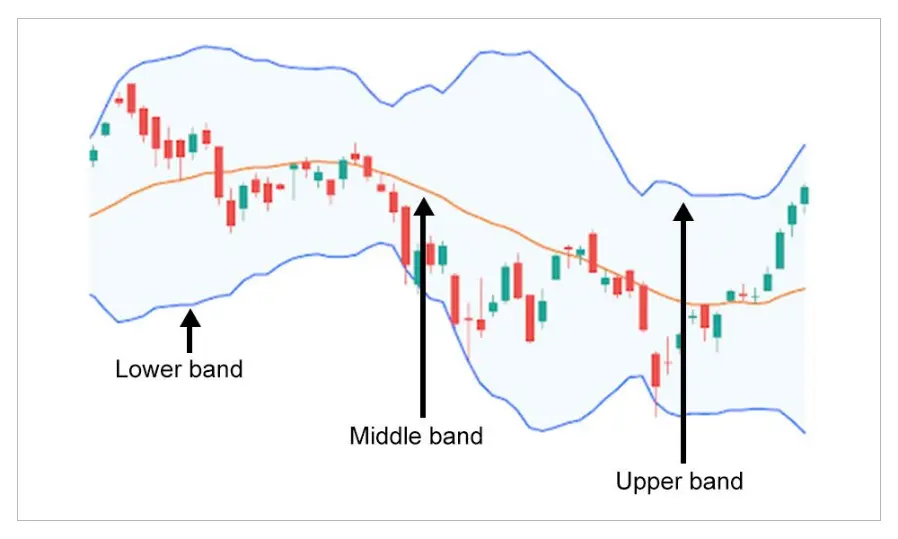
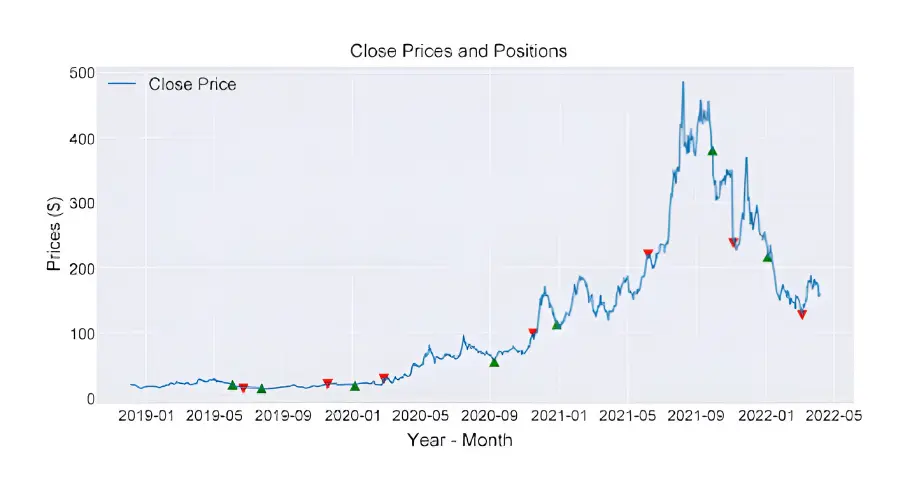
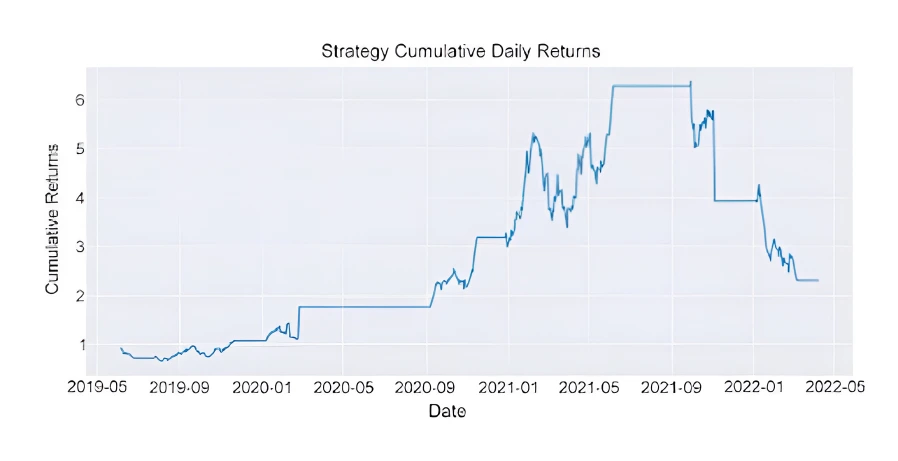
This introduced you to the most used volatility-based trading indicator, Bollinger Bands. You will learn to calculate Bollinger Bands. You will also learn to interpret Bollinger Bands to study the price and volatility of an asset.Bollinger Bands Calculation4m 44sFormulas of Bollinger Bands10mBasics of Bollinger Bands2mMoving Average2mDefinition of Bollinger Bands2mCalculate Bollinger Bands of a Stock5mInterpretation of Bollinger Bands2m 55sEntry and Exit Conditions of Oversold Trading Strategy10mBollinger Bands Study2mElements of Bollinger Bands2mOversold Condition2mOversold Trading Strategy10mOversold Strategy Signals5mAdditional Reading on Bollinger Bands10m- Bollinger Bands PhasesIn this section, you will be introduced to the concept of Bollinger bandwidth. You will learn to study the volatility cycles using the Bollinger Band phases. All four types of Bollinger Band Phases are explained in detail to give you an intuitive understanding.Interpretation of Bollinger Bands Phases5m 20sFormulas of Bollinger Bands Phases10mBollinger Squeeze2mBollinger Phases2mVolatility Cycle2mAdditional Reading on Bollinger Bands Phases10m
Breakout Strategy
In this section, you will understand how to create a trading strategy using Bollinger Band phases. You will learn the entry and exit conditions of the breakout trading strategy designed using the Bollinger Band Phases.Breakout Strategy Using Bollinger Phases6m 54sLong Entry and Exit Rules of Breakout Strategy10mPhase Transition2mLong Breakout Entry Conditions2mVolatility Transition2mBreakout Strategy Implementation10mBB Bandwidth5mEntry Signals5mExit Signal5mAdditional Reading on Breakout Strategy10mBreakout Strategy Blueshift Live/Paper Trading Template10mVIX
Introduction to VIXVolatility During Unexpected Events2mLong Term Effect of Volatility2mVolatility Based Trading2mHedge Index Futures2mPosition in VIX Decline2mTypes of Volatility1m 38sProperty of Implied Volatility2mInterpretation of VIX3m 39sMaximum Value of VIX2mInterpretation of Implied Volatility2mDaily Volatility Using VIX2mVIX and Low Volatility2mAnnualised VIX2mVIX Level Interpretation2mVolatility in Different Time Periods Using VIX2mTypes of VIX1m 47sVolatility Index and S&P5002mTrade Gold VIX Futures2mVIX and Eurozone Volatility Index2mWebinar Snippet - Introduction to Volatility8m 40sWebinar Snippet - Why Is VIX Called the Fear Index?7m- More on VIXCalculation of VIX5m 40sOption Premium During Uncertain Periods2mInclusion of Options Based on Time of Expiry2mExclusion of Options Based on Time of Expiry2mInclusion of Options Based on Moneyness2mType of Options in VIX2mInclusion of Options Based on Bids2mInclusion of Options Based on Consecutive Bids2mProperties of VIX2mCorrelation of VIX and S&P5002mVIX Time Series2mImpact of Positive News on VIX2mVIX Derivatives2mHedge on VIX Futures2mIdentification of VIX Derivatives2mRelationship Between VIX ETNs and VIX Futures2mAdditional Reading10m
- Hedging Using VIXIn this section, you will understand the inverse relationship between VIX and S&P 500. You will learn about the concept of hedge ratio. Further, you will apply the concept of hedge ratio to create a hedging strategy using VIX ETF.Hedging With VIX ETF2m 13sFall in S&P 5002mHedging the Losses2mHedge Ratio2mHedge Ratio - Always a Fixed Value?2mDetermine Hedge Ratio2mPortfolio Hedging Using VIX10mCompute Strategy Parameters5mCalculate Daily Strategy Returns of Combined Portfolio5m
- Selective Long on VIXIn this section, you will improvise on the previous strategy by going selective long on VIX. You will also discover different ways to select when to go long on VIX.Selective Long VIX Strategy5m 12sIdentify Best Performing Assets2mAlways Long on VIXY2mVIXY Monthly Returns2mImprove Strategy Performance2mVIX Levels2mDrawbacks of Fixed VIX Value2mCapture Panic Dynamically2mSMA for Entry2mExit Conditions2mAvailable Cash In Selectively Long Strategy2mSelectively Long Strategy Returns2mCompare Selectively Long with S&P 5002mGoing Selectively Long on VIX10mGenerate Buying Signal5mSelective Long on VIX Blueshift Live/Paper Trading Template10m
- VIX SpreadVIX Spread Concept2m 52sVIX Spread Strategy10mFAQ10mTest on Bollinger Bands and VIX16m
- Understanding BetaIn this section, you will understand the concept of beta and what it is used for. You will learn about systematic and unsystematic risk. You will also discover what type of risk is measured by beta and how beta values are interpreted.Beta and Its Interpretation2mAdditional Reading for Drawbacks of Beta10mIdentify the Type of Risk2mDefine Beta2mIdentify Beta Value2mInterpretation of Beta - I2mInterpretation of Beta - II2mMatch the Beta Value - I2mMatch the Beta Value - II2mSelect a Stock Based on Beta2m
- Calculating BetaThis section explains how to calculate beta using the linear regression model with the help of Python. You will learn about the elements of the regression equation. You will also understand how to get the beta coefficient from a linear regression model.Pre-reading10mHow to Calculate BetaDefine the Variables2mDescribe the Element2mDefine the Slope of Line2mIdentify Approximate Beta2mIdentify the Linear Regression Equation2mIdentify the Beta Value2mIdentify Correlation2mIdentify Volatility2mIdentify the Relevance of Beta2mIdentify the Independent Variable2mCalculate Beta With Python10mIdentify the Number of Trading Days2mAdd the Constant Term5mCalculate Beta5mFetch the Values5m
Betting Against Beta
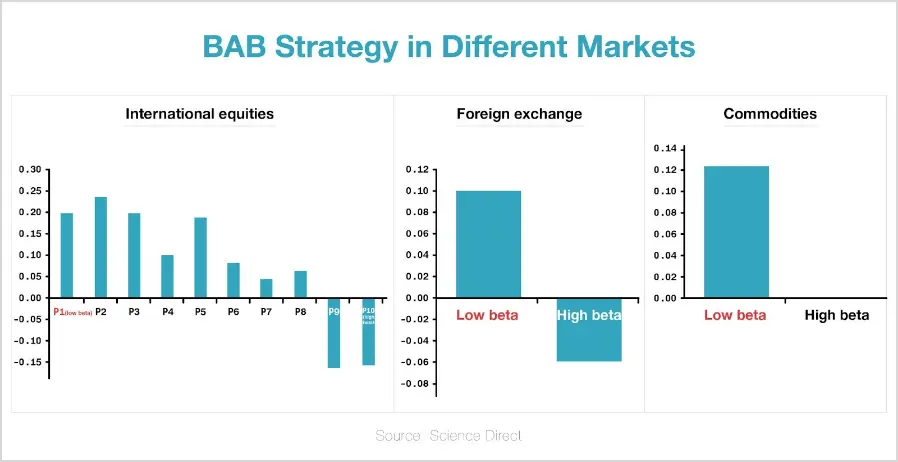
In this section, you will learn about the premise of the “Betting Against Beta” strategy. It includes a simple explanation of the author’s hypothesis. It also includes the steps that are required to implement the strategy.Application of Beta2mDescribe the Use of CAPM2mDefine Risk-free Rate of Return2mDefine Market Risk Premium2mDescribe the Theory of CAPM2mCalculate Expected Returns2mBetting Against Beta3m 35sIdentify the Valuation2mDefine the BAB Strategy2mDescribe the Hypothesis2mDefine Alpha2mSelect a Stock to Buy2mResearch on BAB
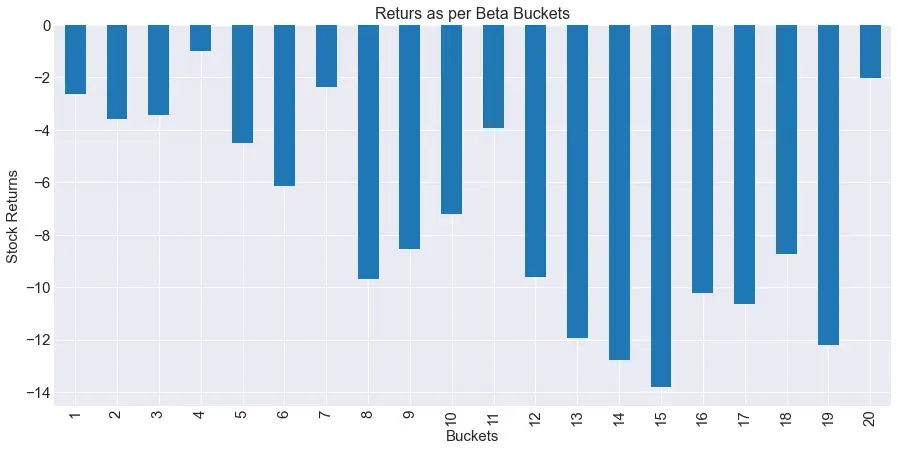
This section attempts to validate the author’s hypothesis of the “Betting Against Beta” or the BAB strategy. This is done by testing the strategy on the past data of S&P 500 stocks and checking if it works by analysing the past performance of these stocks.Research on BABData for Calculating Beta2mDescribe Strategy Testing2mSteps to Implement the BAB Strategy2mIdentify the Order of Ranking2mIdentify the Criteria of Bucket Creation2mResearch on BAB - I10mSplit the data into train & test5mCalculate Beta for Multiple Stocks5mCreate Stock Buckets5mCalculate Average Returns for Each Bucket5mResearch on BAB - II10mBacktesting BAB
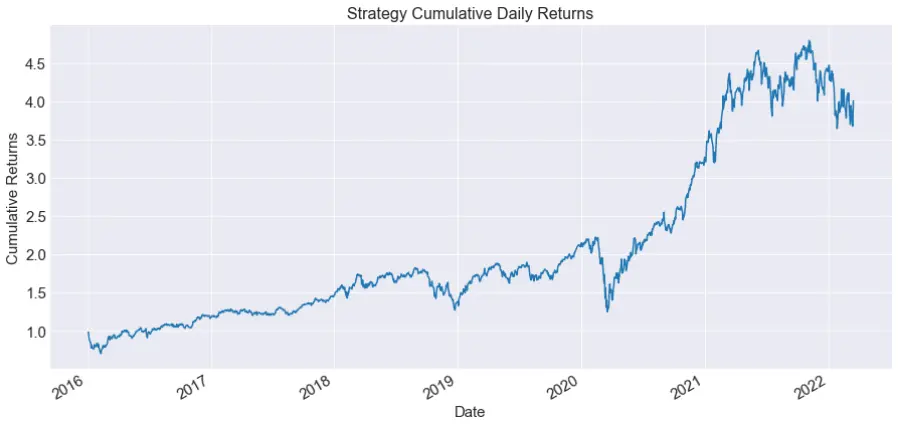
This section will teach you how to backtest a modified strategy based on the research made on the BAB paper in the previous section. On this opportunity, you will go long on high beta stocks to check whether we can be profitable with them. Data will be provided from 2015 to 2022.BAB Backtesting - I10mIdentify the Function2mCalculate the Returns of the Chosen High Beta Stocks5mBAB Backtesting - II10mTest on Beta10m- Run Codes Locally on Your MachineIn this section, you will learn to install the Python environment on your local machine. You will also learn about some common problems while installing python and how to troubleshoot them.Python Installation Overview2m 18sFlow Diagram10mInstall Anaconda on Windows10mInstall Anaconda on Mac10mKnow your Current Environment2mTroubleshooting Anaconda Installation Problems10mCreating a Python Environment10mChanging Environments2mQuantra Environment2mTroubleshooting Tips for Setting Up Environment10mHow to Run Files in Downloadable Section?10mTroubleshooting for Running Files in Downloadable Section10m
- Capstone ProjectThis section will help you to develop a breakout strategy learnt in the Bollinger Bands section in order to identify the top 5 stocks from the S&P 500 that perform well from 2010 to 2022.Capstone Project: Getting Started10mProblem Statement10mFrequently Asked Questions10mCode Template and Data Files2mCapstone Project Model Solution10mCapstone Solution Downloadable2m
- Course SummaryIn this section, we will summarise all the volatility trading concepts and strategies that you have learned throughout the course. By the end of this section, you will get an idea of what you can do next to further improve your trading skills.Summary4m 49sCourse Summary and Next Steps10mPython Codes and Data2m
Registered Successfully!
You will receive webinar joining details on your registered email
Would you like to start learning immediately?
about author


Why quantra®?
- More in Less Time
Gain more in less time
- Expert Faculty
Get taught by practitioners
- Self-paced
Learn at your own pace
- Data & Strategy Models
Get data & strategy models to practice on your own
Faqs
- When will I have access to the course content, including videos and strategies?
You will gain access to the entire course content including videos and strategies, as soon as you complete the payment and successfully enroll in the course.
- Will I get a certificate at the completion of the course?
Yes, you will be awarded with a certification from QuantInsti after successfully completing the online learning units.
- Are there any webinars, live or classroom sessions available in the course?
No, there are no live or classroom sessions in the course. You can ask your queries on community and get responses from fellow learners and faculty members.
- Is there any support available after I purchase the course?
Yes, you can ask your queries related to the course on the community: https://quantra.quantinsti.com/community
- What are the system requirements to do this course?
Fast-speed internet connection and a browser application are required for this course. For best experience, use Chrome.
- What is the admission criteria?
There is no admission criterion. You are recommended to go through the prerequisites section and be aware of skill sets gained and required to learn most from the course.
- Is there a refund available?
We respect your time, and hence, we offer concise but effective short-term courses created under professional guidance. We try to offer the most value within the shortest time. There are a few courses on Quantra which are free of cost. Please check the price of the course before enrolling in it. Once a purchase is made, we offer complete course content. For paid courses, we follow a 'no refund' policy.
- Is the course downloadable?
Some of the course material is downloadable such as Python notebooks with strategy codes. We also guide you how to use these codes on your own system to practice further.
- Can the python strategies provided in the course be immediately used for trading?
We focus on teaching these quantitative and machine learning techniques and how learners can use them for developing their own strategies. You may or may not be able to directly use them in your own system. Please do note that we are not advising or offering any trading/investment services. The strategies are used for learning & understanding purposes and we don't take any responsibility for the performance or any profit or losses that using these techniques results in.
- I want to develop my own algorithmic trading strategy. Can I use a Quantra course notebook for the same?
Quantra environment is a zero-installation solution to get beginners to start off with coding in Python. While learning you won't have to download or install anything! However, if you wish to later implement the learning on your system, you can definitely do that. All the notebooks in the Quantra portal are available for download at the end of each course and they can be run in the local system just the same as they run in the portal. The user can modify/tweak/rework all such code files as per his need. We encourage you to implement different concepts learnt from different learning tracks into your trading strategy to make it more suited to the real-world scenario.
- If I plug in the Quantra code to my trading system, am I sure to make money?
No. We provide you guidance on how to create strategy using different techniques and indicators, but no strategy is plug and play. A lot of effort is required to backtest any strategy, after which we fine-tune the strategy parameters and see the performance on paper trading before we finally implement the live execution of trades.
- What does "lifetime access" mean?
Lifetime access means that once you enroll in the course, you will have unlimited access to all course materials, including videos, resources, readings, and other learning materials for as long as the course remains available online. There are no time limits or expiration dates on your access, allowing you to learn at your own pace and revisit the content whenever you need it, even after you've completed the course. It's important to note that "lifetime" refers to the lifetime of the course itself—if the platform or course is discontinued for any reason, we will inform you in advance. This will allow you enough time to download or access any course materials you need for future use.
- What is Volatility in Trading?
Volatility essentially measures how much an asset's price fluctuates over a given period. Think of it as the 'speed' and 'intensity' of price moves. Higher volatility means prices are changing rapidly, while low volatility suggests more stable prices. Understanding volatility is crucial because it directly impacts risk and potential returns. In this course, you will learn to identify different volatility environments using real-world stock examples and understand their direct impact on your trading outcomes.
- Why is measuring Volatility important for a trader?
Measuring volatility is key because it helps traders assess risk, set appropriate entry and exit points, and even find profit opportunities. Fixed trading parameters often fail in dynamic markets. Knowing how volatile an asset is helps you adjust your strategy to suit current market conditions, preventing premature stop-loss triggers or missed profit opportunities. This course will show you how to quantify volatility using specific technical indicators and leverage this understanding to build more robust trading strategies.
- What is a Moving Average Crossover and how is it used?
Moving Average Crossover is a fundamental technical analysis tool used to identify trend changes and potential trading signals. It involves plotting two moving averages (one "fast" and one "slow") on a price chart. When the fast moving average crosses above or below the slow one, it often signals a shift in momentum or direction. In this course, you will learn to calculate moving averages and implement crossover strategies in Python to generate precise entry signals for your trades.
- What is the Average True Range (ATR) indicator?
The Average True Range (ATR) is a technical indicator that measures market volatility by calculating the average range of price movement over a specified period. Unlike indicators that smooth price data, ATR focuses on the "true range" of an asset, accounting for gaps and limit moves. It doesn't tell you the direction of the trend, but rather how much an asset's price is moving on average. You will discover how to calculate and interpret ATR, then apply it to dynamically adjust your stop-loss and take-profit levels for improved risk management.
- How can I set effective Stop-Loss and Take-Profit levels?
Fixed stop-loss and take-profit levels can be ineffective because market volatility is constantly changing. A level that's appropriate on a calm day might be too tight during higher volatility, leading to unnecessary losses. Dynamic levels, which adapt to market conditions, can help optimize your risk-reward profile. This course will guide you through the limitations of fixed exits and teach you how to use ATR to set intelligent, adaptive stop-loss and take-profit levels that respond to real-time market volatility.
- What are Bollinger Bands, and how do they indicate volatility?
Bollinger Bands are a popular volatility indicator consisting of three lines: a simple moving average (the middle band), and upper and lower price bands that are typically two standard deviations away from the middle band. The width between the upper and lower bands indicates volatility – wider bands suggest higher volatility, while narrower bands suggest low volatility. You will learn the precise calculation and various interpretations of Bollinger Bands, including how to identify trend strength and potential "squeezes" or expansions that signal significant price moves.
- What is the VIX (Volatility Index) and why is it important for traders?
The VIX, often called the "fear index," is a real-time market index representing the market's expectation of 30-day forward-looking future volatility. It's derived from the option prices of S&P 500 index options contracts. A rising VIX typically signals increasing market fear and expected volatility, while a falling VIX suggests complacency. This course will explore different types of VIX, its derivatives (futures, ETFs, options trading), and demonstrate how you can strategically use them for speculation and, importantly, for hedging your portfolio against downturns.
- How can VIX ETFs be used for portfolio hedging?
VIX Exchange Traded Funds (ETFs) offer a way to gain exposure to the VIX index without directly trading the index itself. They are often used as a hedging tool because the VIX tends to move inversely to the stock market during periods of high fear. By taking a position in VIX ETFs, traders can potentially mitigate losses in their equity portfolio during market declines. You will be taught practical strategies, including how to use Bollinger Bands, to identify optimal entry and exit points for hedging your portfolio with VIX ETFs, illustrated with real-world examples.
- What is the VIX futures curve, and what does it tell us?
The VIX futures curve plots the prices of VIX futures contracts across different expiration months. Its shape provides critical insights into market sentiment and expectations of future volatility. "Contango" (upward sloping) is the normal state, suggesting expected volatility to return to average. "Backwardation" (downward sloping) indicates high near-term volatility, often reflecting market fear. This course will demystify the VIX futures curve, explaining contango, backwardation, and their implications for understanding underlying market complacency or fear.
- What's the difference between historical volatility and implied volatility?
Historical volatility (or realized volatility) is a backward-looking measure, calculated from an asset's past price movements over a specific period. Implied volatility, on the other hand, is a forward-looking measure. It represents the market's expectation of future volatility for an asset, derived from the option prices of options contracts on that asset, and reflects how much the market expects the price to move in the future.
- What is implied volatility, and why is it important in trading strategies?
Implied volatility (IV) is the market's forecast of an asset's likely price range, deduced from option prices. It's important because it directly impacts option premiums – higher volatility generally means a higher price for options. Traders use IV to gain insight into market sentiment (e.g., high IV can signal market fear or anticipated big price moves), to price options, and to inform strategies like simultaneously selling options when IV is high or buying options when IV is low, expecting a return to the mean.
- What's the connection between volatility and trading volume?
Often, there's a positive correlation between volatility and trading volume. Significant price moves (higher volatility) can attract more traders, leading to increased trading activity and thus higher volume. Conversely, a sudden surge in volume can sometimes precede volatility spikes, as large sell orders or buy orders disrupt market equilibrium. However, this isn't always a direct cause-and-effect; both can be reactions to various factors like underlying news or market events.
- How does understanding volatility help in making trading decisions?
Understanding volatility helps traders in several ways: it assists in setting appropriate stop-loss and take-profit levels that adapt to market conditions, rather than using fixed, arbitrary points. It aids in position sizing, where higher volatility might warrant smaller positions to manage risk. It also helps identify suitable trading strategies, as some thrive in higher volatility (e.g., breakout strategies) while others are better suited for low volatility (e.g., range-bound strategies).
- What is the role of VIX in general volatility trading strategies?
The VIX (Volatility Index), often called the "fear index," is a key barometer of market fear and expected volatility, specifically for the S&P 500 index listed on the Chicago Board Options Exchange. In general volatility trading strategies, VIX plays a crucial role as a standalone trading instrument (via futures, ETFs, or options trading) for speculation or hedging against market risk. A rising VIX often correlates with falling equity markets, making it a popular tool for portfolio protection during downturns.
- What are the different types of volatility trading strategies?
Volatility trading strategies are generally considered to fall into two broad categories: directional and non-directional. Directional strategies might involve buying underlying assets expected to become more volatile or less volatile. Non-directional strategies, often using options or complex derivatives, aim to profit from changes in volatility itself, regardless of the underlying asset's price direction. Examples include long/short volatility strategies, arbitrage, and various options spread strategies (e.g., straddles, strangles).
- How does trading volatility with options compare to using other instruments?
Options are highly sensitive to implied volatility, making them a primary tool for pure volatility plays. Strategies like buying straddles profit from any large price moves, while simultaneously selling straddles can profit from low volatility. Other instruments, like stocks or ETFs, can be traded based on volatility indicators (e.g., using ATR for dynamic exits or Bollinger Bands for breakouts) but typically rely on directional price moves. VIX futures and ETFs offer direct exposure to market volatility itself.
- What’s the difference between long volatility and short volatility strategies?
Long volatility strategies aim to profit when market volatility increases. This often involves buying options (like calls, puts, straddles), or VIX futures/ETFs. These strategies benefit from large, unpredictable price moves. Short volatility strategies aim to profit when market volatility decreases or remains low. This typically involves selling options (like naked calls/puts, straddles) or VIX futures/ETFs, collecting the premium received as volatility declines or stays contained, with the risk that options may expire worthless if volatility stays too low.
- What are volatility arbitrage strategies, and how do they work?
Volatility arbitrage strategies seek to profit from discrepancies between an underlying asset's implied volatility (derived from option prices) and its historical volatility or expected volatility. For example, if implied volatility is significantly higher than actual volatility, a volatility trader might sell options while simultaneously hedging the directional risk of the underlying stock, expecting implied volatility to converge with realized volatility. These are often complex strategies requiring sophisticated modeling and execution.
- How does one identify high volatility trading opportunities?
High volatility trading opportunities can be identified by looking for underlying assets where implied volatility is spiking (e.g., before earnings announcements or major news), or where historical volatility metrics like ATR or Bollinger Bands show expansion. Analyzing the VIX index for overall market volatility and identifying stocks with higher volatility (high Beta) can also point to high-volatility candidates.
- What are the best indicators for volatility trading strategies?
Some of the most commonly used indicators for volatility trading strategies include: Average True Range (ATR), Bollinger Bands, the VIX (Volatility Index), Standard Deviation, and Keltner Channels. These indicators help quantify and visualize volatility for strategic trading decisions.
- How are Bollinger Bands typically used in volatility trading strategies?
Bollinger Bands are versatile for volatility trading. When the bands contract (squeeze), it often signals a period of low volatility, potentially preceding a significant price move (price breaks). Traders might look to enter positions expecting a breakout. When the bands expand, it indicates increasing volatility, confirming strong trends or significant price action. Traders can also use the bands as dynamic support/resistance levels.
- How do macroeconomic events affect volatility trading strategies?
Macroeconomic events, such as interest rate changes, inflation reports, GDP data, and geopolitical developments, are major catalysts for market volatility. These events can cause sudden and large price moves across markets. Volatility traders often anticipate these announcements, as they can lead to a sharp rise in implied volatility (making long volatility strategies appealing) or trigger significant directional moves that can be exploited by breakout or trend-following volatility trading strategies.
- Is volatility trading profitable in all market conditions?
No. Like any trading approach, volatility trading is not profitable in all market conditions. Strategies designed for higher volatility (e.g., long options, VIX products) will struggle in low volatility, sideways markets. Conversely, strategies designed for low volatility (e.g., selling options, range trading) can be severely impacted by volatility spikes. Successful volatility trading involves matching the strategy to the prevailing or expected volatility regime.
- How do volatility trading strategies perform during market crashes?
During market crashes, volatility typically skyrockets. Strategies that are "long volatility" (e.g., buying VIX futures/ETFs, or holding put options on broad market indices) tend to perform exceptionally well and can provide significant profit potential or act as effective hedges. Strategies that are "short volatility" (e.g., selling options) can suffer massive losses due to the rapid and extreme increase in implied volatility and underlying price movements.
- Are volatility trading strategies suitable for short-term or long-term trading?
Volatility trading strategies can be suitable for both short-term and long-term trading, depending on the specific strategy and instruments used. Many volatility plays, especially those involving options or VIX derivatives, are inherently short-to-medium term due to time decay (for options) or contango effects (for VIX futures/ETFs). However, long-term investors might also employ volatility-aware strategies for portfolio rebalancing or hedging against systemic market risk.
- How does risk management work in volatility trading?
Risk management in volatility trading is paramount. It involves: adjusting position size based on the asset's current price volatility; using dynamic stop-loss orders (often based on indicators like ATR); diversifying across strategies or assets to mitigate risk; using hedging instruments (like inverse ETFs or options); and always understanding the maximum potential loss before entering a trade. It's about controlling exposure to rapid price moves and sudden market shifts to protect money.
- Can you give examples of real-world volatility trading strategies?
Real-world examples include: a Long Straddle/Strangle (buying both a call and a put on an underlying asset at the same or different strike prices) to profit from large price moves regardless of direction; a Short Straddle/Strangle (selling both a call and a put) to profit from the price staying within a narrow range, where the premium received is the main profit potential; a Volatility Breakout Strategy using Bollinger Bands when the price breaks out of consolidation; and VIX ETF Hedging for portfolio protection during market uncertainty.
- How do beginners get started with volatility trading strategies?
Beginners should start by learning the fundamental concepts of volatility and how it's measured. Then, they should familiarize themselves with key indicators like ATR, Bollinger Bands, and VIX. It's crucial to practice strategies in a simulated (paper trading) environment to gain insight and experience without financial risk. They should start with small amounts of capital for live trading and always prioritize robust risk management.
- How to backtest volatility trading strategies effectively?
Effective backtesting involves using clean, reliable historical data; accounting for realistic trading costs (slippage, commissions); performing out-of-sample testing to avoid overfitting; evaluating performance with comprehensive metrics beyond just profit (e.g., maximum downside drawdown, Sharpe ratio); and utilizing programming tools like Python with appropriate libraries for rigorous analysis of strategies discussed.
- Can volatility trading strategies be automated using Python?
Yes, many volatility trading strategies can be automated using Python. Its rich ecosystem of libraries for data analysis (pandas), technical indicator calculations (TA-Lib), and backtesting frameworks (backtrader, Zipline) makes it an excellent language. Traders can code their strategy rules, run extensive historical simulations, and even connect to brokerage APIs for automated execution, allowing for systematic and disciplined trading.
- What are common mistakes to avoid in volatility trading strategies?
Common mistakes include: ignoring comprehensive risk management (e.g., over-leveraging or failing to implement dynamic stop-loss orders); misinterpreting indicators' context; over-optimizing strategies to fit historical data; emotional trading during rapid price action; trying to "fight the trend" of volatility itself; and failing to account for time decay or contango effects when using options or VIX futures, which can cause profit to expire worthless.