How to Use Skew Rank in Trading?
The Black-Scholes pricing model assumes constant volatility.
But in the real world, things are far more dynamic. We often see out-of-the-money puts priced with higher implied volatility than their call counterparts, revealing the market’s hidden fears—this is the volatility skew. By quantifying this skew, you can unlock deeper market insights and sharpen your trading edge. You can use skew rank to quantify this skew and create your trading strategy.
In this Quantra post, we will discuss how skew rank is used in options trading.
The Advanced Options Volatility Trading: Strategies and Risk Management course of Quantra covers skew rank and its use in options trading.

All the concepts covered in this post are taken from the Quantra course Advanced Options Volatility Trading: Strategies and Risk Management. You can preview the concepts taught in this post by clicking on the free preview button and going to Section 17 and Unit 7 and Section 18 and Unit 6 of the course.
Note: The links in this tutorial will be accessible only after logging into quantra.quantinsti.com.
Note that backtesting results do not guarantee future performance. The presented results are intended solely for educational purposes and should not be interpreted as investment advice.
In this post, we will cover the following topics:
- Importance of Skew Rank
- Calculation of Skew Rank
- Backtest Skew Rank-Based Short Straddle Strategy
If you want to know about the concept and calculation of the volatility skew, head on over to this link: How to Trade Options Using Volatility Skew?
Importance of Skew Rank
Let's take two stocks, Apple and Tesla. Both stocks’ skew values and their range in the past time period are given.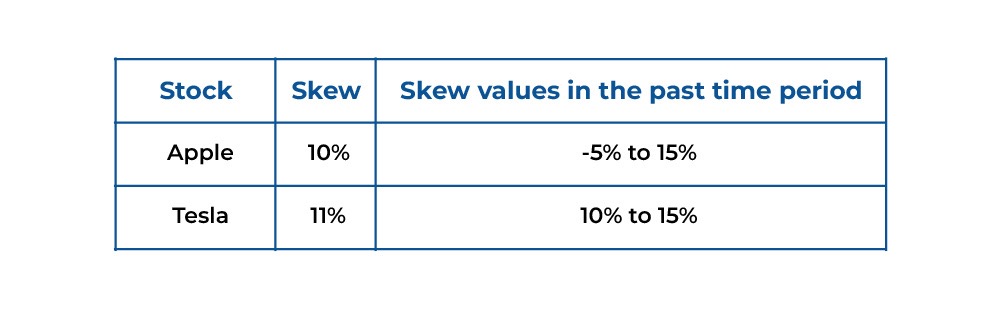
Apple has skew values from -5% to 15%. Here, we have considered a one-year time period, which is the standard time period.
Initially, you would think that Tesla’s skew value is higher compared to Apple. But if you compare Tesla’s skew value in comparison to the past time period, you realise that Tesla’s skew value is on the lower side. On the other hand, Apple’s skew value is higher in comparison to the recent past.
Why does the range of skew values matter?
If the volatility skew is higher, it implies that the OTM Puts are more costly in relation to the OTM calls. People are buying OTM puts as they need protection causing the OTM put IV to rise, implying markets are poised to decline.
If you want to create a strategy on the asset with a high skew value, you should have chosen Apple, which you cannot tell by looking at skew alone.

Note: The link will be accessible only after logging into quantra.quantinsti.com.
Calculation of Skew Rank
The time period considered for comparing the current IV value with the past IV values is usually one year. The formula for the calculation of skew rank is shown below.

Figure: Skew Rank Formula
Why do we subtract the minimum skew from the current skew in the numerator?
You want to know how far the current skew is from the start of this range. That is why we subtract the minimum skew from the current skew in the numerator.
Why do you think we subtract the minimum skew from the maximum skew in the denominator?
That’s simple, we want to find the range of the asset’s skew values.
So if Apple’s skew was moving between 20 and 30, the range would be 10.
Once you have the numerator and denominator, you will multiply the result by 100 to get the skew rank in percentage.
Let's take the example of Apple’s skew value in the past 5 days.
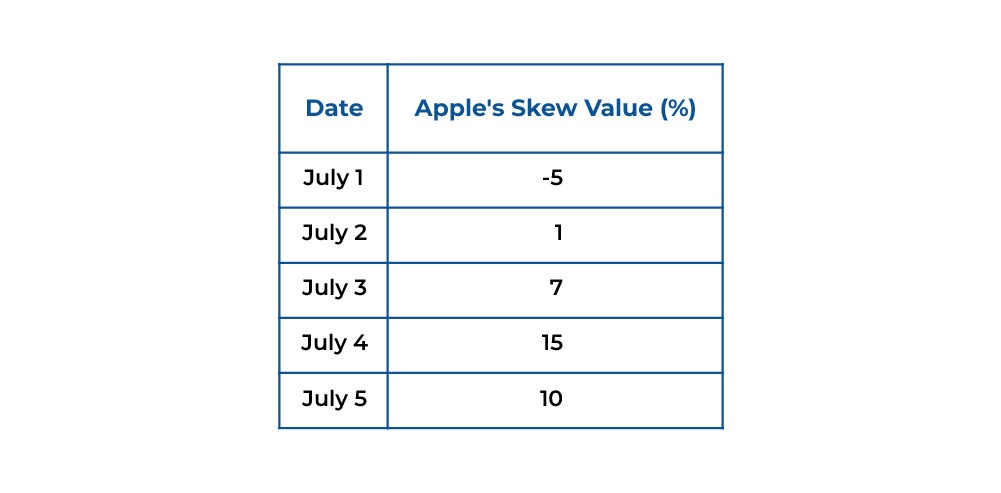
The minimum skew value is -5%. Maximum skew value is 15%. And the current skew value is 10%.
Skew Rank = 10 - (-5)15 - (-5) * 100 = 15/20 = 75%
So the skew rank is 75%. This means that the skew value is on the higher side in comparison to the range of skew values in the past five days.
And what about Tesla?
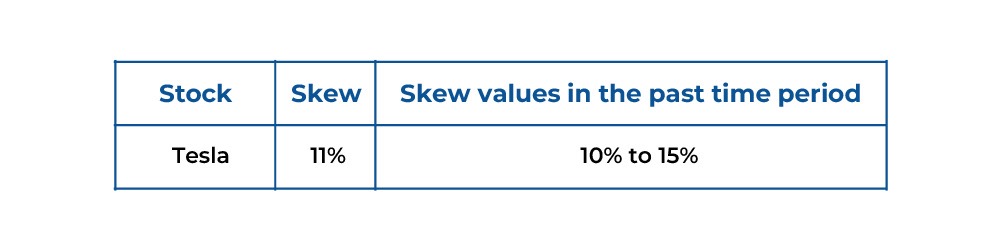
Skew Rank = 11 - 1015 - 10 * 100 = 1/5 = 20%
Tesla's skew rank is 20%. This means that the skew value is on the lower side in comparison to the range of skew values in the past five days.
We can see that Apple's skew rank is higher. This implies that more people are expecting a correction in the underlying asset of Apple in comparison to Tesla.
That’s great! You have learnt how to calculate the skew rank for an asset’s option.
Note: The past time period of 5 days was taken for illustration purposes. In general, 1 year is used as the past time period.
Let’s try to interpret skew rank now.
A high skew rank implies a higher expectation of the market that there will be a directional move.
A low skew rank includes the possibility of a negative skew value as well. A negative skew occurs when the out-of-the-money put option’s IV is lower than the out-of-the-money call options’ IV. This means the market expects a directional move if the skew rank is low as well.
Hence, if the skew rank is towards the extreme, like 10% or 90% then there is an expectation of a directional move in the market.
Backtest Skew Rank-Based Short Straddle Strategy
In this post, we will use two variables to create a unique trading strategy. We will use both IV Rank and Skew Rank to create a short straddle-based options strategy.
If you want to know more about IV Rank, you can read it here: How to Use IV Rank in Options Trading?
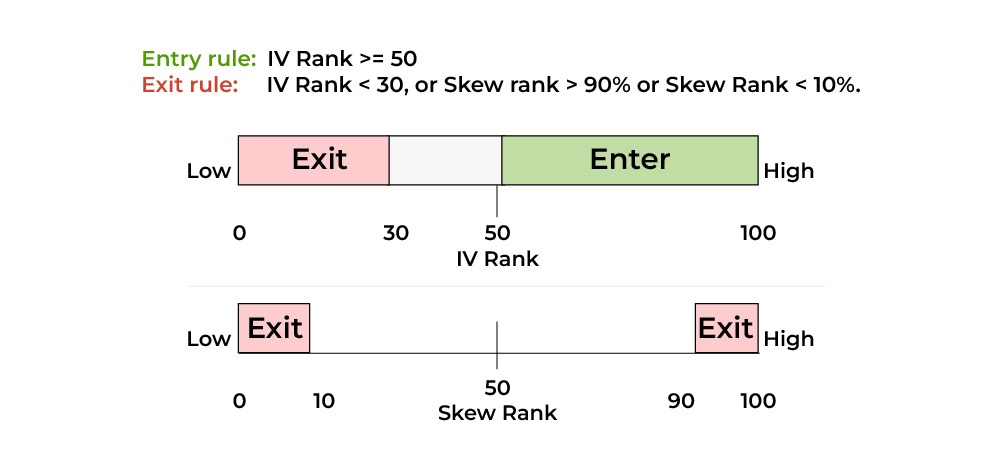
IV Rank has values from 0 to 100%. We can define the IV values with IV Rank 50% to 100% as high IV. Similarly, the IV values with IV Rank below 50% can be considered as low IV values.
Thus, you will set up a short straddle when the IV rank is equal to or above 50%.
And when do you exit?
You will exit when the following two criteria are met:
- If the IV rank is less than 30%, or
- If the skew rank is above 90% or lower than 10%.
How does the strategy perform?
The strategy was backtested on SPX end-of-month options for the time period between 2015 and 2023, and the total PnL was $4425.05 (assuming the lot size of 5).
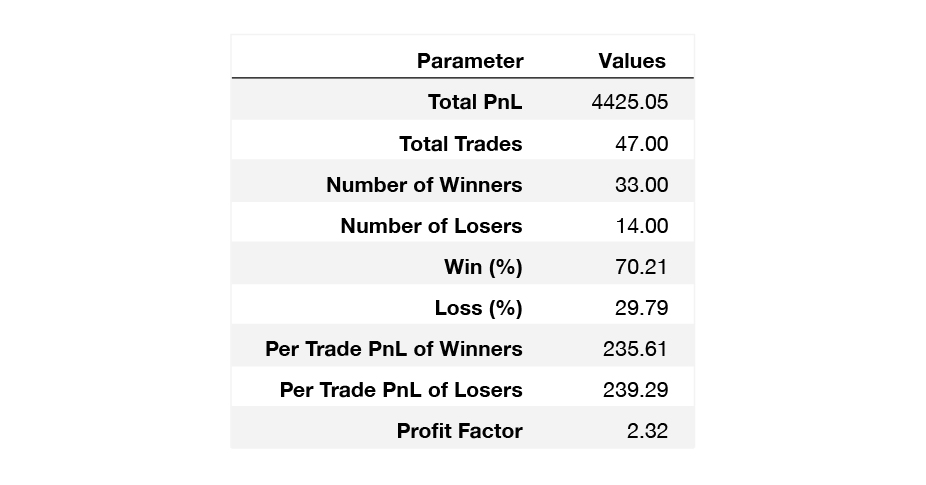
Figure: Strategy Performance
Note that backtesting results do not guarantee future performance. The presented results are intended solely for educational purposes and should not be interpreted as investment advice.
If you want to backtest the skew rank, and IV rank-based short straddle strategy using Python, you can refer to the notebook in section 18 and Unit 6 of the course ‘Advanced Options Volatility Trading: Strategies and Risk Management’.

What to do next?
Take a free preview of the course ‘Advanced Options Volatility Trading: Strategies and Risk Management’. Dive into advanced options volatility concepts with practical applications and focus on risk management. Learn to calculate IV skew, IV rank, and skew rank. Develop entry and exit rules using machine learning and volatility properties.

IMPORTANT DISCLAIMER: This post is for educational purposes only and is not a solicitation or recommendation to buy or sell any securities. Investing in financial markets involves risks and you should seek the advice of a licensed financial advisor before making any investment decisions. Your investment decisions are solely your responsibility. The information provided is based on publicly available data and our own analysis, and we do not guarantee its accuracy or completeness. By no means is this communication sent as the licensed equity analysts or financial advisors and it should not be construed as professional advice or a recommendation to buy or sell any securities or any other kind of asset


