How to Use IV Rank in Options Trading?
It is well known that professional traders deploy short straddle options trading strategies when they see that the IV is high and is going to decrease.
But how do you quantify the fact that IV is high?
In this post, we will use the concept of IV rank to do just that. The
Advanced Options Volatility Trading: Strategies and Risk Management course of Quantra covers IV rank and its use in options trading.

All the concepts covered in this post are taken from the Quantra course Advanced Options Volatility Trading: Strategies and Risk Management. You can preview the concepts taught in this post by clicking on the free preview button and going to Section 13 and Unit 1 and Section 14 and Unit 6 of the course.
Note: The links in this tutorial will be accessible only after logging into quantra.quantinsti.com
Note that backtesting results do not guarantee future performance. The presented results are intended solely for educational purposes and should not be interpreted as investment advice.
In this post, we will cover the following topics:
- Importance of IV Rank
- Calculation of IV Rank
- Backtest IV Rank-Based Short Straddle Strategy
If you are new to options trading, check out our free course ‘Options Trading Strategies: Basics’.
Importance of IV Rank
Let’s take the IV values and their ranges in the last year of two stocks, Apple and Tesla.
|
Stock |
Current IV |
Range of IV in the past year |
|
Apple |
30% |
10% to 40% |
|
Tesla |
35% |
30% to 80% |
Initially, you think that Tesla has a higher IV than Apple, and between the two stocks, you would want to set up a short straddle on Tesla since it has a higher current IV than Apple.
But looking at the range of IV values of Tesla in the past year, the current IV value is actually at the lower end. In comparison, Apple’s current IV value is on the higher side compared to its IV range in the past year.
You know that a high IV implies that option sellers are demanding a higher premium for the options. So people are paying a higher premium for Apple now than in the past year.
This is where IV rank can help you as it tells you where the asset’s IV is relative to its range over the past year.

Note: The link will be accessible only after logging into quantra.quantinsti.com.
Calculation of IV Rank
The time period considered to compare the current IV value with the past IV values is usually one year. The formula for the calculation of IV rank is shown below.

Figure: Formula of IV Rank
Why do you think we subtract the minimum IV from the maximum IV in the denominator?
That’s simple, we want to find the range of the asset’s IV.
So if Apple’s IV was moving between 20 and 30, the range would be 10.
Why do we subtract the minimum IV from the current IV?
You want to know how far the current IV is from the start of this range. That is why we subtract the minimum IV from the current IV in the numerator.
Let’s take an example of the stock Apple on July 5th 2024 and its IV for 5 days.
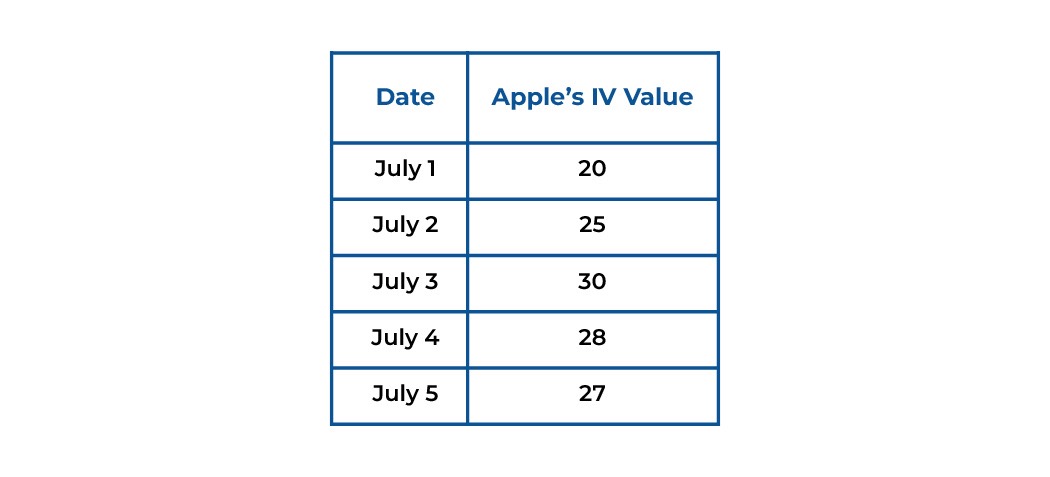
Figure: Range of IV Values
These values are for illustration purposes. For this example, let’s assume that the time period we are considering is 5 days for calculating the IV rank.
The current IV is 27, the maximum value is 30, and the minimum value is 20.
Figure: Formula of IV Rank
The range of IV values is 10, hence the denominator is 10.

In percentage terms, it will be 70%.
This means that the IV rank’s value is 70% of the entire range of Apple’s IV in the last 5 days.
That’s great! You have learnt how to calculate the IV rank for an asset’s option.
Note: The past time period of 5 days was taken for illustration purposes. In general, 1 year is used as the past time period. Let’s try to interpret IV rank now.
An IV rank of 80% indicates that Apple’s IV is currently on the higher side in relation to the past time period. This implies that, currently, traders are paying a higher premium in comparison to the past.
Conversely, an IV rank of 30% means that Apple’s IV is currently on the lower side in relation to the past time period. This implies that, currently, traders are paying a lower premium in comparison to the past.
We will use this intuition to create a short straddle options trading strategy.
Backtest IV Rank-Based Short Straddle Strategy
IV Rank has values from 0 to 100%. We can define the IV values with IV Rank 50% to 100% as high IV. Similarly, the IV values with IV Rank below 50% can be considered as low IV values.
Thus, you will set up a short straddle when the IV rank is equal to or above 50%.
And when do you exit?
Since we want to exit when the IV is low, we can exit when the IV rank is less than 30%.
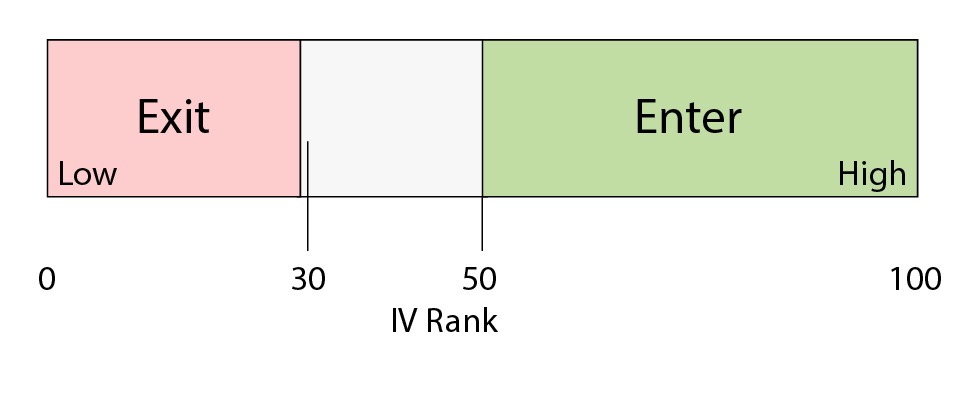
Figure: Entry and Exit Rule for IV Rank-Based Short Straddle Strategy
How does the strategy perform?
The strategy was backtested on SPX end-of-month options for the time period between 2015 and 2023, and the total PnL was $3262.50 (assuming the lot size of 5).
If you want to backtest the IV rank-based short straddle strategy using Python, you can refer to the notebook in section 14 and Unit 6 of the course ‘Advanced Options Volatility Trading: Strategies and Risk Management’.

What to do next?
Take a free preview of the newly launched course ‘Advanced Options Volatility Trading: Strategies and Risk Management’. Dive into advanced options volatility concepts with practical applications and focus on risk management. Learn to calculate IV skew, IV rank, and skew rank. Develop entry and exit rules using machine learning and volatility properties.
Enroll in the course and take advantage of a limited-time 75% discount!

IMPORTANT DISCLAIMER: This post is for educational purposes only and is not a solicitation or recommendation to buy or sell any securities. Investing in financial markets involves risks and you should seek the advice of a licensed financial advisor before making any investment decisions. Your investment decisions are solely your responsibility. The information provided is based on publicly available data and our own analysis, and we do not guarantee its accuracy or completeness. By no means is this communication sent as the licensed equity analysts or financial advisors and it should not be construed as professional advice or a recommendation to buy or sell any securities or any other kind of asset.


