How to Trade Options Using Volatility Skew?
In this post, we're diving into a crucial concept in the options trading: the volatility skew.
Options trading can be both thrilling and complex, and mastering its intricacies can significantly enhance your trading prowess. One such crucial element is volatility skew.
We'll unravel the mysteries of volatility skew, delving into its concept, how to calculate, risk management, trading strategy and backtesting.
The idea of volatility skew isn't new in options trading, but it gained significant attention after the Black Monday on October 19, 1987. This historic day saw the Dow Jones Industrial Average (DJIA) plummet over 22.6% in a single trading session.
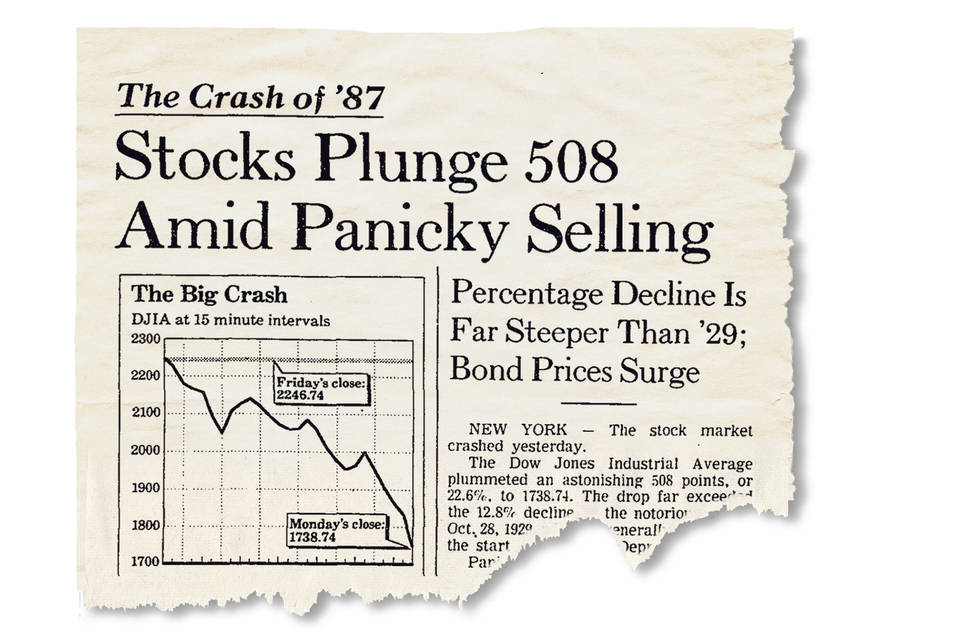
Source: WSJ
All the concepts covered in this post are taken from the Quantra course Options Trading Strategies In Python: Intermediate. You can preview the concepts taught in this course by clicking on the free preview button and going to Section 11 and Unit 1 of the course.
Note: The links in this tutorial will be accessible only after logging into quantra.quantinsti.com

The following is covered in this Quantra Classroom
- What is Volatility Skew?
- How to calculate volatility skew?
- Interpretation of volatility skew
- Strategy
- Backtesting
- Analysing performance
What is Volatility Skew?
Imagine you're looking at options for a particular stock or index. Now, normally, you'd expect the implied volatility (expected price swings) to be kind of similar across all the options, regardless of whether they're call options (betting on the price going up) or put options (betting on the price going down).
But here's where the skew comes in: sometimes, the market behaves in a way that makes one type of option more expensive than the other.
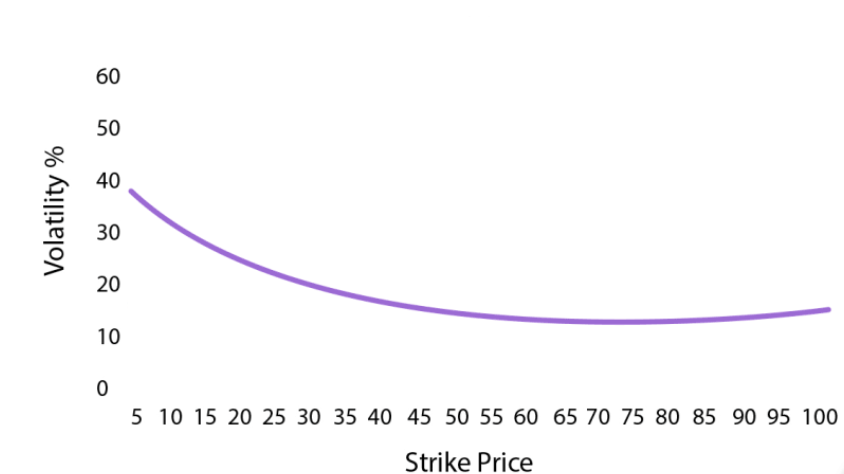
For example, let's say traders are feeling jittery about the stock market. They might be more willing to pay extra for OTM put options as a form of insurance against a big drop in prices. So, the prices of those OTM put options get bumped up, creating a "skew" where the implied volatility is higher for OTM puts compared to OTM calls.
Conversely, in times when investors are feeling more optimistic, they might be more interested in call options, thinking the market will go up. In this case, the prices of OTM call options might be higher relative to OTM put options, creating a skew in the other direction. Though, this is seen less often in the real world.
Volatility skew is basically the tendency for options of one type (calls or puts) to be priced differently than the other due to market sentiment or conditions. It's like a little slant in the options pricing landscape that savvy traders keep an eye on to gauge market sentiment and potential risks.
You can learn the full concept of volatility skew from the video in the course Options Trading Strategies In Python: Intermediate
Note: You need to login and enroll into a free preview to watch the video.
What is Implied Volatility?
Implied Volatility (IV) represents the expected level of price fluctuation for a specific security, as perceived by traders. Traders utilise IV to anticipate potential price swings in a security, effectively gauging the associated market risk. In bearish market conditions, IV tends to rise as investors anticipate declines in equity prices. Conversely, during bullish phases, IV typically decreases as investors expect prices to rise.
How to calculate volatility skew?
The volatility skew formula is determined by finding the difference between the implied volatility (IV) of the out-of-the-money (OTM) put and the IV of the OTM call, and then dividing this difference by the IV of either the at-the-money (ATM) call or put option, resulting in a ratio.
Skew = IV of OTM PUT - IV of OTM Call / IV of ATM Call (or PUT)
Let us look at an example for understanding the calculation of skew and subsequently generating trading signals based on it.
Consider options and futures on the S&P500 index.
The S&P500 futures was trading at 4976 on February 13, 2024, therefore a 4900 put will be OTM and a 5000 call will be OTM. The call at 4950 is closest to the current value of the futures contract and can be considered to be ATM. (Put at 4950 can also be considered.) The table below summarises these values in a succinct format.
Future Price = 4976 on 13th February 2024.
|
Strike |
OTM Put IV |
ATM IV |
OTM Call IV |
|
4900 |
11.46% |
||
|
4950 |
10.94% |
||
|
5000 |
10.75% |
Skew is calculated by finding the difference between the closest OTM Put IV and the closest OTM Call IV and then, normalising the results by dividing the resultant difference by the ATM IV, which is 11.46 minus 10.75 divided by 10.94. This results in a positive skew of 6.42%, suggesting that the puts are priced higher than the calls.
Skew = IV of OTM PUT - IV of OTM Call / IV of ATM Call (or PUT)
=11.46 - 10.7510.94= 6.42%
Thus, the table will be as follows.
|
Strike |
OTM Put IV |
ATM IV |
OTM Call IV |
|
4900 |
11.46% |
||
|
4950 |
10.94% |
||
|
5000 |
10.75% |
||
|
SKEW |
6.42% |
How to interpret volatility skew?
If volatility skew is higher or increases, it implies that the OTM Puts are more costly in relation to the OTM calls.
When we next calculated the skew for the next day, it turned out to be 8.37%, as shown in the table.
Future Price = 5055 on February 19, 2024.
|
Strike |
OTM Put IV |
ATM IV |
OTM Call IV |
|
5100 |
11.49% |
||
|
5050 |
10.76% |
||
|
5000 |
10.59% |
||
|
SKEW |
8.37% |
How to create a trading strategy?
There is a significant rise in the value of skew, which implies that the difference between the price of puts and calls has increased further.
People are buying OTM puts as they need protection causing the OTM put IV to rise, implying markets are poised to decline.
To benefit from this viewpoint, we will take positions in the index futures and will also hedge our position in the futures using options.
- We will short futures and
- Go long on call options to cover the losses in case our prediction goes wrong
This is how we can build a strategy to predict market movements by analysing the volatility skew.
How do we ensure that this strategy is effective?
One word, Backtesting!
Steps to Backtest the Strategy
- Read the Futures and options data
- Calculate ATM Strike Price and, OTM Call and Put Strike Prices
- Calculate Implied Volatilities of ATM and OTM Strike Prices
- Calculate Volatility Skew
- Is Volatility Skew < -5%? Set signal to 1
- If not, then check if 10% ≥ Volatility Skew ≥ -5%. If yes, then set signal to 0, else -1
The values of -5% and 10% are taken for illustration purposes only. It is recommended to take a moving average of 10 days and compare it with current skew to determine if skew has increased or decreased.
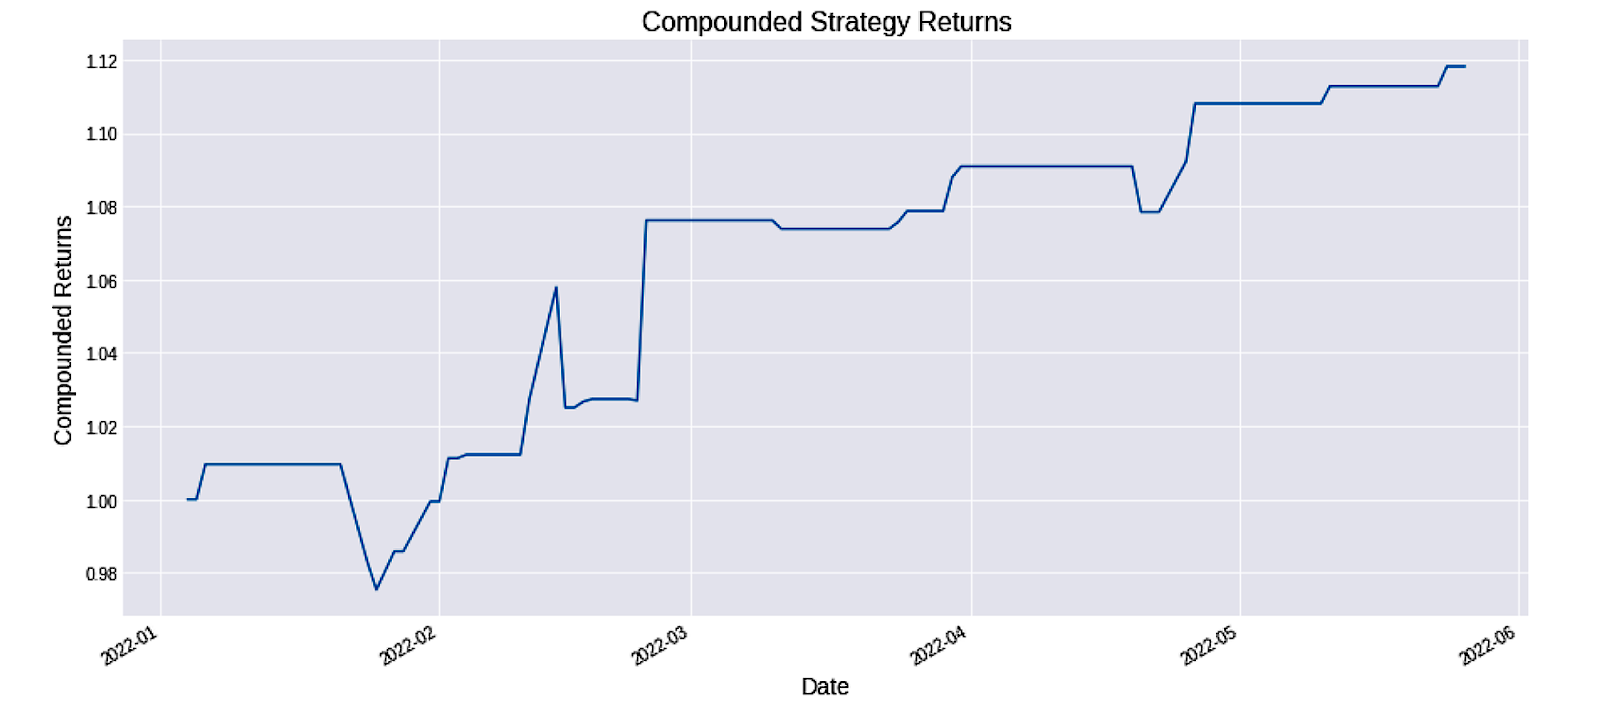
Following a backtesting analysis conducted on the NIFTY index spanning from January 2022 to May 2022, the cumulative returns of this strategy amounted to 1.12 times the initial investment. It is important to note that options trading carries inherent risks, and past backtesting results do not guarantee future performance. The presented strategy results are intended solely for educational purposes and should not be interpreted as investment advice. A comprehensive evaluation of the strategy across multiple parameters is necessary to assess its effectiveness.
The backtesting of the volatility skew-based strategy has been covered in detail along with the Python code in this unit of the Options Trading Strategies In Python: Intermediate course. You need to take a Free Preview of the course by clicking on the green-coloured Free Preview button on the right corner of the screen next to the FAQs tab and go to Section 11 and Unit 5 of the course.
What to do next?
- Go to this course
- Click on
- Go through 10-15% of course content
- Drop us your comments and queries on the community

IMPORTANT DISCLAIMER: This post is for educational purposes only and is not a solicitation or recommendation to buy or sell any securities. Investing in financial markets involves risks and you should seek the advice of a licensed financial advisor before making any investment decisions. Your investment decisions are solely your responsibility. The information provided is based on publicly available data and our own analysis, and we do not guarantee its accuracy or completeness. By no means is this communication sent as the licensed equity analysts or financial advisors and it should not be construed as professional advice or a recommendation to buy or sell any securities or any other kind of asset.


