How to Trade Delta Neutral Volatility Skew?
Many options traders are familiar with volatility skew, yet it often remains a puzzle. However, approaching it from a delta neutral angle can help you see the market in a way that brings subtle shifts into focus.
But what is delta neutral volatility skew, and how can you create a trading strategy around it?
In this post, we’ll break down the concept of delta neutral volatility skew, explore how this approach works, and provide practical insights on how you can incorporate it into your trading strategy. The Advanced Options Volatility: Delta-Neutral Skew & Portfolio Hedging course on Quantra explores many such advanced options volatility concepts with practical applications with a special focus on risk management.
All the concepts covered in this post are taken from the Quantra course Advanced Options Volatility: Delta-Neutral Skew & Portfolio Hedging. You can preview the concepts taught in this post by clicking on the free preview button and going to Section 10 and Unit 6 of the course.


Note that backtesting results do not guarantee future performance. The presented results are intended solely for educational purposes and should not be interpreted as investment advice.
In this post, we will cover the following topics:
- What is volatility skew?
- Why does volatility skew exist?
- Why use the delta neutral approach for calculating the skew?
- How to calculate delta neutral volatility skew?
- How to trade based on the delta neutral skew values?
If you are new to Options trading, the Options Trading Strategies In Python: Intermediate course would be helpful.
What is Volatility Skew?
Volatility skew refers to the difference in implied volatility (IV) between options with different strike prices but the same expiration date. Typically, options with strike prices below the current market price (puts) tend to have higher IVs than those above it (calls). This difference creates a skew, which can be graphically represented by plotting the IV against the strike prices.
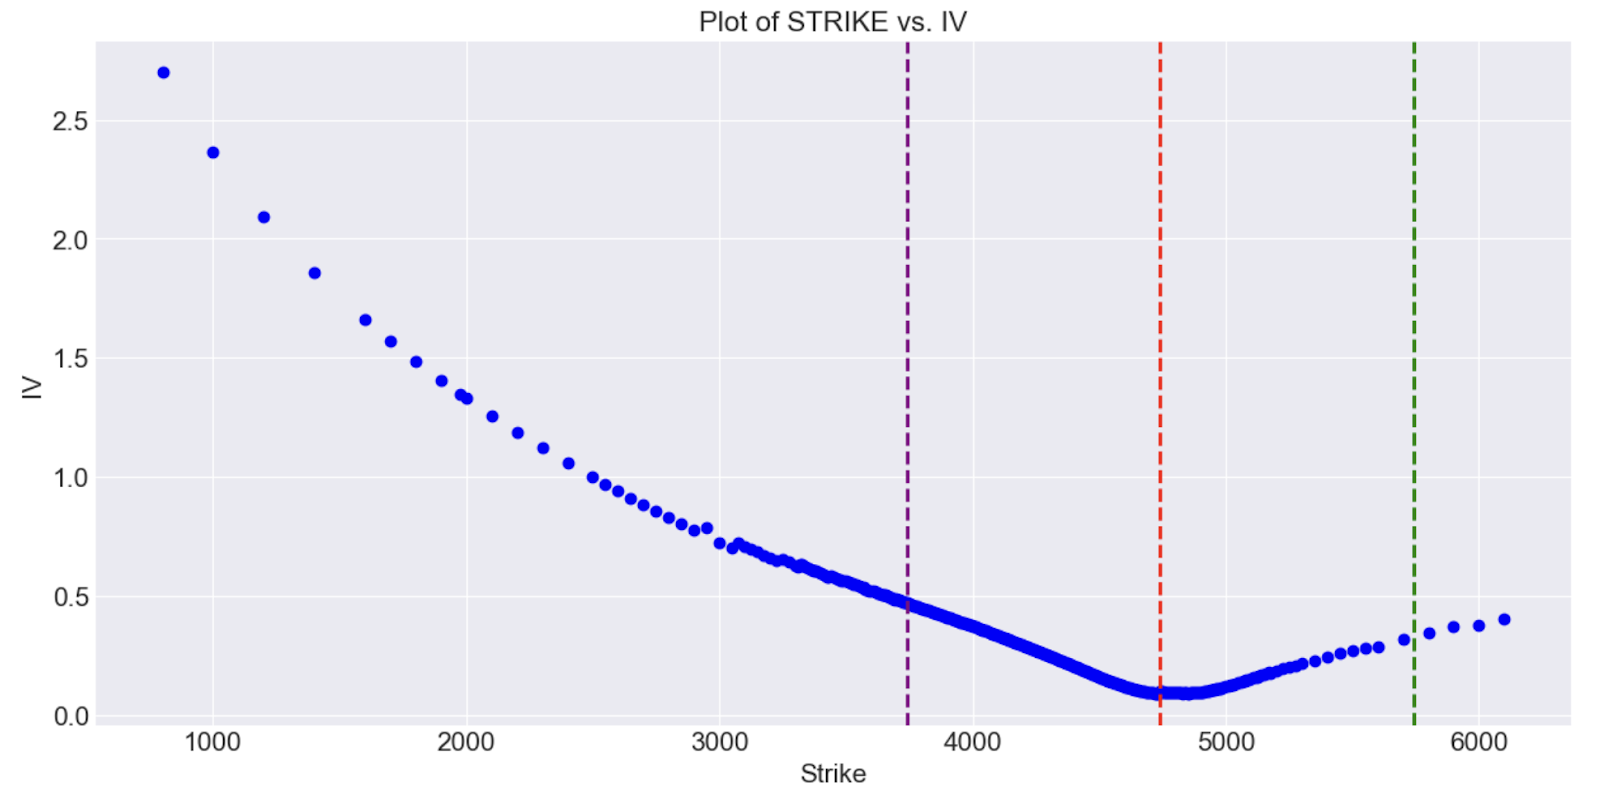
IV Surface
The resulting curve often slopes downward for equities because out-of-the-money (OTM) puts are more expensive than OTM calls. This is due to the higher demand for downside protection.
Why does Volatility Skew exist?
Volatility skew exists due to the market’s perception of risk and demand for options. Different factors, such as investor sentiment, demand for hedging, and historical price behaviour, contribute to this skew. For instance, in equity markets, investors often seek protection against significant downside moves, leading to higher demand for put options. This demand increases the IV for puts compared to calls, creating a skew. Also, the market’s belief that sharp price drops are more likely than sharp price rises contributes to the skew. Economic events, earnings announcements, and market volatility are some other factors that influence the skew.
There are various methods to quantify this skew. Let us explore one of these methods - delta neutral skew calculation.
Why use the Delta Neutral approach for calculating the skew?
A delta neutral volatility skew involves maintaining a portfolio where the net delta—representing the sensitivity of the portfolio’s value to small changes in the underlying asset’s price—is neutral or close to zero while focusing on the volatility skew. By balancing the net delta, the trader’s position is less sensitive to directional market moves, making it a volatility play rather than a directional bet. In other words, the traders can identify opportunities where the market may be overestimating or underestimating volatility at certain strikes, regardless of whether the underlying asset is moving up or down.
Now the next question that would come to your mind would be–which delta value should be taken for calculating the skew for options volatility trading. Although you can take any value of your choice, there is a study that suggest using 0.25 delta as it is neither too high nor too low for calculating the volatility skew.
How to calculate Delta Neutral Volatility Skew?
The formula for calculating the skew values is:
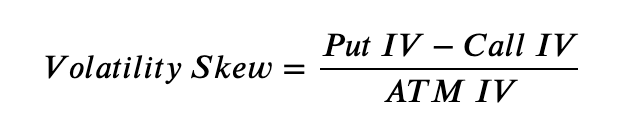
where,
Put IV is the IV of the put option with a delta value of -0.25
Call IV is the IV of the call option with a delta value of 0.25
ATM IV is the average IV of the ATM call and put options
Note: We have taken the values 0.25 and -0.25 for illustration purposes only. You can modify this as per your preferences.
How to trade based on the Delta Neutral Skew values?
One way to trade the volatility skew can be using a contrarian approach. If the skew is positive, it means that the put IV premium is greater than the call IV premium, indicating a higher demand for downside protection compared to upside speculation. However, generally the market's perception of risk is exaggerated or skewed, presenting an opportunity to trade as volatility levels adjust. Hence, we will take a long position when the skew crosses above the threshold of 10%. As the put IV usually tends to be higher than the call IV we do not find many instances where the call IV is greater than the put IV hence the skew threshold for going short is taken as -5%. These threshold values are taken for illustration purposes only and can be changed as per your preferences.
Long Entry and Exit Signals:
- Entry Condition: A long position in the underlying asset is opened when the value of volatility skew is greater than 10%.
- The long position is held as long as the value of volatility skew is greater than 10%.
- Exit Condition: The long position is closed when the value of volatility skew is less than or equal to 10%.
Short Entry and Exit Signals:
- Entry Condition: A short position in the underlying asset is opened when the value of volatility skew is less than -5%.
- The short position is held as long as the value of volatility skew is less than -5%.
- Exit Condition: The short position is closed when the value of volatility skew is greater than or equal to -5%.

Trading Signals
The strategy discussed above has been covered in detail along with the Python code in this unit of the Advanced Options Volatility: Delta-Neutral Skew & Portfolio Hedging course. You need to take a Free Preview of the course by clicking on the green-coloured Free Preview button on the right corner of the screen next to the FAQs tab and go to Section 10 and Unit 6 of the course.
Note that backtesting results do not guarantee future performance. The presented strategy is intended solely for educational purposes and should not be interpreted as investment advice.

What to do next?
- Go to this course
- Click on "Free Preview"
- Go through 10-15% of course content
- Drop us your comments and queries on the community

IMPORTANT DISCLAIMER: This post is for educational purposes only and is not a solicitation or recommendation to buy or sell any securities. Investing in financial markets involves risks and you should seek the advice of a licensed financial advisor before making any investment decisions. Your investment decisions are solely your responsibility. The information provided is based on publicly available data and our own analysis, and we do not guarantee its accuracy or completeness. By no means is this communication sent as the licensed equity analysts or financial advisors and it should not be construed as professional advice or a recommendation to buy or sell any securities or any other kind of asset.


