Options Volatility Trading: Concepts and Strategies
₹12150/-₹48599/-
75% OFF
Get for ₹10328 with Course Bundle
- Live Trading
- Learning Track
- Prerequisites
- Syllabus
- About author
- Testimonials
- Faqs
Apply Options Volatility Trading Strategies
- Recall and differentiate between risk and edge in options trading.
- Explain the concepts and characteristics of options Greeks, including Delta, Theta, Rho, Vega, and Gamma.
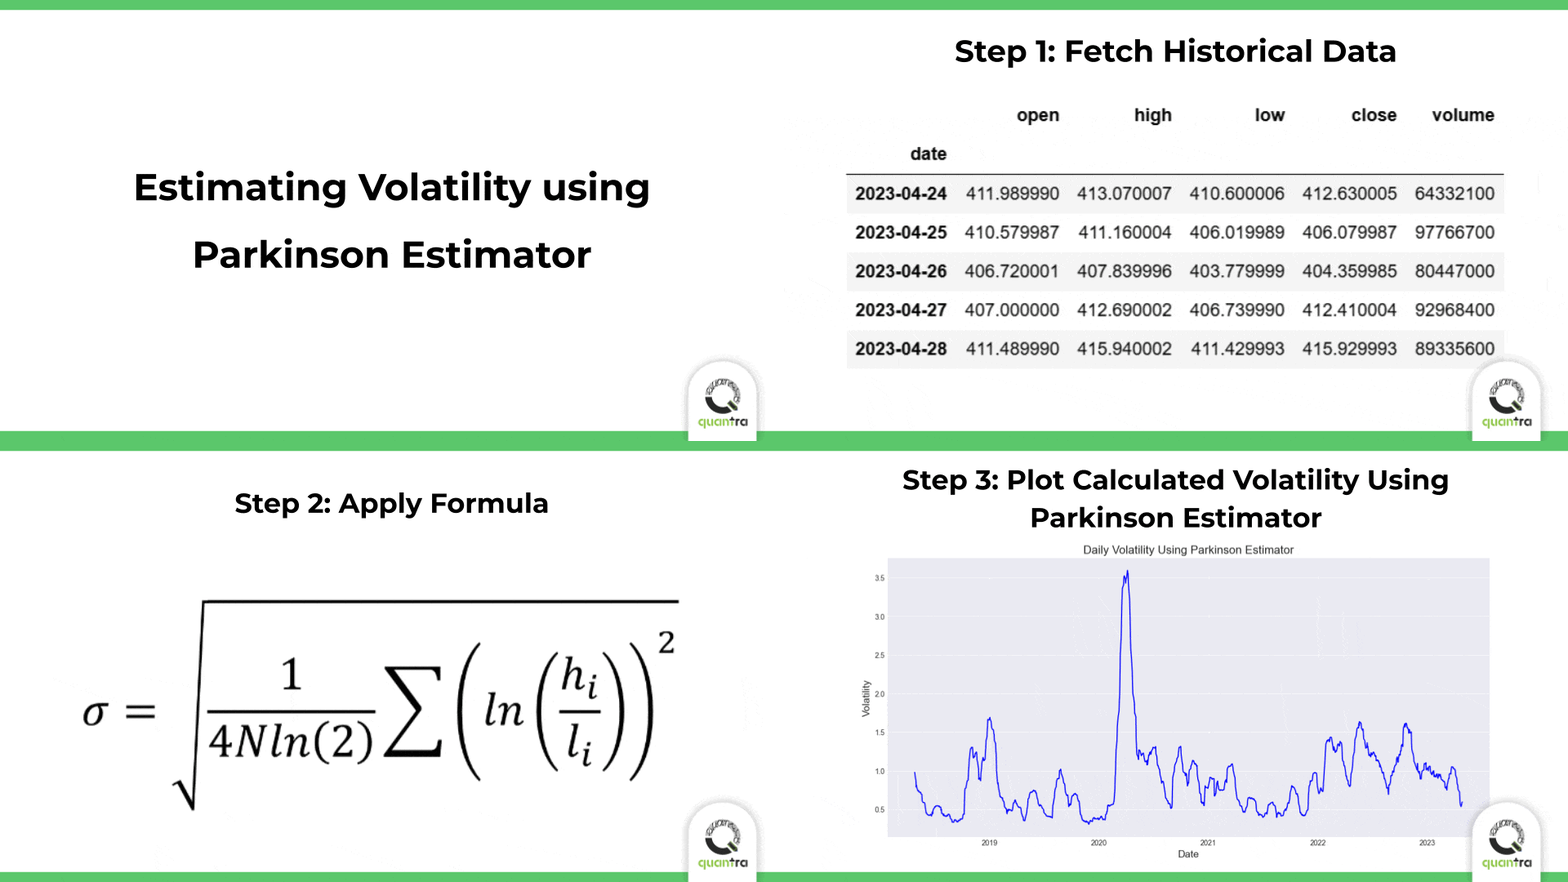
- Demonstrate an understanding of volatility estimation techniques, including close-to-close, Parkinson, and Garman-Klass estimators.
- Explain the GARCH model and its application in forecasting volatility.
- Apply Monte Carlo simulation to estimate the profit and loss (P/L) distribution of straddle and strangle options positions.
- Backtest and evaluate a volatility-based options trading strategy using historical data.
- Utilise capstone project and live trading templates to implement learned concepts in real-world trading scenarios.

Skills Required for Volatility Trading
Strategies
- GARCH Model-based strategy
- VIX-based Straddle
Concepts & Trading
- Options Greeks
- Volatility Estimation
- GARCH
- Monte-Carlo Simulation
Python
- Pandas
- Numpy
- Matplotlib
- Mibian
- Scipy

learning track 3
This course is a part of the Learning Track: Quantitative Trading in Futures and Options Markets
Course Fees
Full Learning Track
These courses are specially curated to help you with end-to-end learning of the subject.
Course Features
- Community
Faculty Support on Community
- Interactive Coding Exercises
Interactive Coding Practice
- Capstone Project
Capstone Project Using Real Market Data
- Trade & Learn Together
Trade and Learn Together
- Get Certified
Get Certified
Prerequisites
Fluency with Python including Python libraries like Pandas, Numpy, Matplotlib and a good understanding of financial markets. You can enroll for the Python for Trading: Basic course on Quantra to attain a basic level of understanding of Python. You can also check the Stock Market Basics course for understanding financial market terms.
Options Volatility Trading Course
- IntroductionOptions volatility trading is a trading style that aims to capitalise on changes in volatility to generate profits. This section introduces the course contents and a welcome address by Dr. Euan Sinclair. The interactive methods used in this course will assist you in not only understanding the concepts but also answering all questions about options volatility trading. This section explains the course structure as well as the various teaching tools used in the course, such as videos, quizzes, coding exercises, and the capstone project.Course Introduction5m 2sCourse Structure2m 20sCourse Structure Flow Diagram2mFAQs2mQuantra Features and Guidance2m 38sOptions Trading: Key Takeaways4m 56s
- Sourcing Options DataOption Type and Applicability2mSourcing US Options Data2mOptions Data Storing5mData Vendors2m
Edge and Risk
In options trading, you could be trading either because you have an edge, i.e., an advantage over others, or because you are taking a risk. Before anyone trades, one should understand the difference between the two in order to be a successful trader. This section points out the difference between edge and risk, and their various types with the help of examples.Making Money: Edge2mEdge and Risk4m 12sConcept of Edge5mDifference Between Edge and Risk5mContrast Between Edge and Risk5mClassification of Edge5mExample of Inefficiency5mDefinition of Situational Trade5mThe Efficient Market Hypothesis5mExistence of Edge5mRelation of Time and Stock Price5mCreation of Mathematical Model5mRisk Premium and Scalability5mTrading Process2mFAQs2m- American vs European OptionsWhen it comes to options trading, two common types of contracts are American options and European options. While they share some similarities, there are key differences that traders need to be aware of. This section discusses the differences between American and European options and answers important questions about exercising the American options.American vs European Options3m 32sAmerican Versus European Options5mOptions Value5mExercising American Options5mAdditional Reading for American vs European Options2m
- Put and Call ParityThe put-call parity helps us understand the relationship between the put and call for the same underlying asset and if there is any arbitrage possible. In this section, you will dive deep into the put-call parity concept and understand how it is viewed by options traders.Put Call Parity Principle3m 33sAssumption of Put Call Parity5mPurpose of Put Call Parity5mEquation of Put Call Parity5mApplication of Put Call Parity5mArbitrage and Put Call Parity5mFAQs2mOverview2mTest on Put/Call Parity and Types of Options10m
Pricing Models
Options pricing models are crucial tools for evaluating the value of options and making informed decisions. In this section, we will explore the mechanics of pricing models, using a simplified binomial model as an example. Additionally, we will delve into the derivation and explanation of the renowned Black-Scholes-Merton model.Why Trade Options?3m 50sOptions Pricing4m 23sOptions Pricing Model5mHedging the Portfolio5mPortfolio Value5mModel Equation5mBenefit of Options Pricing5mMeaning of Hedging5mImplication of Risk Neutrality5mHedging Directional Risk5mToy Binomial Model5mHow to Use an Options Pricing Model?6m 19sPre-Reading on Taylor's Expansion2mBlack-Scholes-Merton Model3m 35sBSM Model5mImpact on Hedged Portfolio5mImpact of Stock Price Movement5mTime Derivatives5mTaylor Expansion in BSM5mSecond Order Terms in Taylor Series5mHigher Order terms in BSM5mReturns in BSM Model5mTime and Price Movements in BSM Model5mComponents of Hedged Portfolio5mAdditional Reading on Pricing Models2m- Options ValuationThis section delves deeper into the workings of the Black-Scholes-Merton (BSM) model and specifically focuses on its application to European options. In this section, you will explore the properties of the BSM equation and learn more about BSM with the help of an example solution. This section also includes an illustration of how to solve the equation using Python. After completing this section you will be able to explain the interpretation of the solution and you will get a comprehensive understanding of the BSM model and its implicationsBSM for European Options4m 48sPut Value5mCall/Put Value5mZ-score5mBehaviour of Call Option5mExtrinsic Value of Call/Put5mExtrinsic Value5mBSM Equation5mBehaviour of Put Options5mValue of Options5mAnalysis of the Options' Intrinsic and Extrinsic Values5mGet the Call Value5mGet the Put Value5mAdditional Reading on Options Valuation2mFAQs on Pricing Models and Options Valuation2m
Greeks: Price & Time
Greeks are financial metrics that traders can use to measure the factors that affect the price of an options contract. In this section you will learn about three important greeks: Delta, Gamma and Theta.Keeping Money: Risk Management2mDelta3m 43sMost Important Greek5mATM Options Delta5mStaying Delta Neutral5mDelta of Put Option5mMeaning of Delta5mReplication Strategy5mDelta of OTM Call Options5mGamma1m 51sDefinition of Gamma5mGamma of European Options5mGamma at Expiration5mGamma of a Position5mGamma of Puts and Calls5mEffect of Stock Increase on Delta5mSignificance of Managing Delta5mTheta2m 21sTheta Decay5mTheta Equation5mHighest Theta5mSelling Options for Theta5mFactors Affecting Theta5mCorrelation Between Theta and Gamma5mBalancing Theta5m- Greeks: Volatility and Interest RatesWhen it comes to option pricing, two important factors that play a significant role are volatility and interest rates. The section involves the study of how volatility and interest rates affects option pricing by discussing the greek Vega and Rho.Vega1m 17sDefinition of Vega5mFormula of Vega5mHighest Vega5mMeaning of Vega5mGamma vs Vega5mEffect of Increase in Volatility5mRho1m 45sExpressing Rho5mAffect on Rho5mImpact of Time to Expiration5mReason for Less Attention to Rho5mOptions Denominated in a Currency5mMeaning of Rho5mAdditional Reading for Option Greeks2mTest on Options and its Greeks16m
- VolatilityBy understanding and effectively utilising volatility, you can navigate the complexities of options trading. After completing this section, you will be able to define volatility and list the customary practices while measuring volatility. You will also be able to explain the characteristics of volatility and the points that you need to consider at the time of estimating volatility.What is Volatility?2mVolatility3m 23sDefine Volatility5mAnnualised volatility5mValue of N5mSample Size and Sample Error5mMeasurement of Volatility5mVolatility Estimation5mVolatility using Daily Returns5mChoosing N5mAnnualise the Volatility Measure5mSelection of N5mVolatility Characteristics and Considerations3m 29sEmpirical Regularities of Volatility5mNature of Volatility5mChallenges of Using a Complex Model5mSimple vs Complex Model5mSelection of Volatility Estimator5mSignificance of Empirical Regularities of Volatility5mMean Reversion of Volatility5mVolatility Clustering5mAdditional Reading on Volatility2m
- Implied VolatilityIn this section, we will explore the significance of implied volatility in options pricing and its relationship with market expectations. You will gain a clear understanding of implied volatility as both an input and an output of pricing models. Additionally, you will learn about the reasons behind volatility skew and grasp concepts such as IV term structure and forward volatility.Implied Volatility2mOptions Price and Volatility5mImplied Volatility5mUnderlying Asset and IV5mModel Dependence of IV5mCharacteristic of IV in BSM Model5mVolatility Skew3m 41sIV in BSM Model5mIV Curve5mConvexity in IV5mExistence of Volatility Skew5mIndication of Volatility Skew5mIV Term Structure and Forward Volatility2m 15sExpected Volatility5mIV and Market Conditions5mForward Volatility5mImplied Surface5mRepresentation by IV5mHistorical and Implied Volatility5mSlope of IV Curve5mIV Changes Due to Convexity5mAdditional Reading on Implied Volatility2mFAQs on Volatility and Implied Volatility2mTest on Volatility and Implied Volatility14m
Close-to-Close Estimator
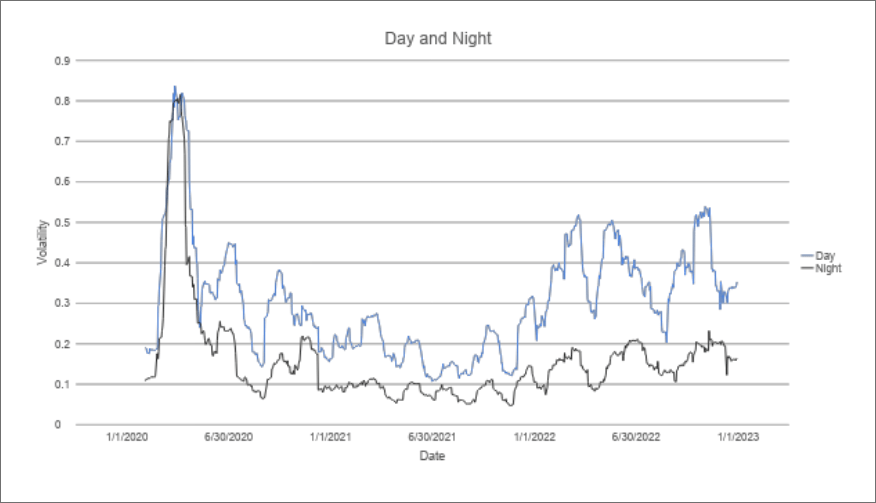
In order to begin our quest to find the perfect volatility estimator, you will start with the most basic as well as popular estimator, i.e., the close-to-close estimator. In this section, you will estimate volatility using the close prices of an asset, as well as understand the difference between day and night volatility. Further, you explore the limitations of this volatility estimator.Close-to-Close Estimator2m 39sMeasurement of Volatility5mInputs for Measurement of Volatility5mValue of Mean Return5mOptimum Number of Periods5mLimitation of Close-to-Close Estimator3m 49sSampling Error in Close-to-Close Estimator5mSampling Error and Number of Time Periods5mElimination of Error5mEstimation of Overnight Volatility5mRole of Number of Days in Estimation of Volatility5mCommon Limitation of Estimators5mTime Scale and Volatility Estimation5mVolatility Estimation for Intraday Data5mClose-to-Close Estimator of Volatility5mCalculate Log Returns5mCalculate Daily Volatility5mCalculate Annualised Volatility5mCalculate Total Volatility Using Day and Night Volatility5mAdditional Reading2mFAQs2mParkinson Estimator
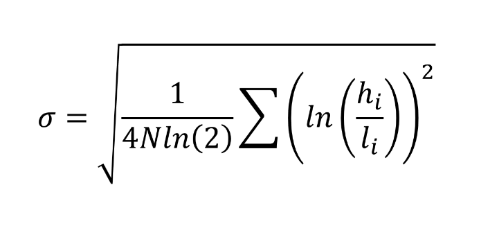
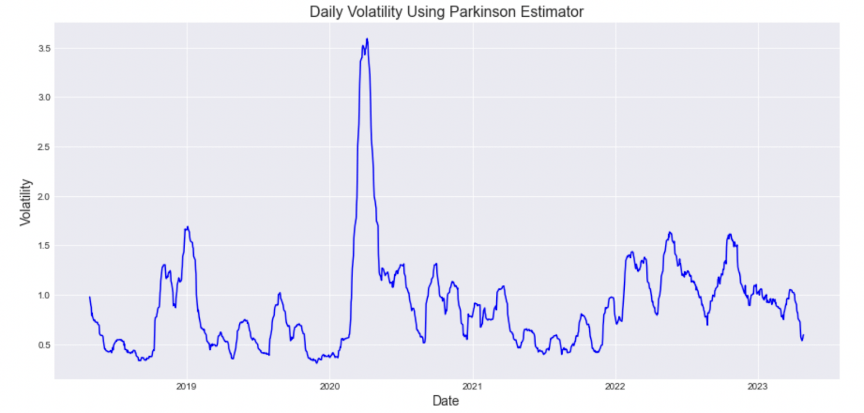
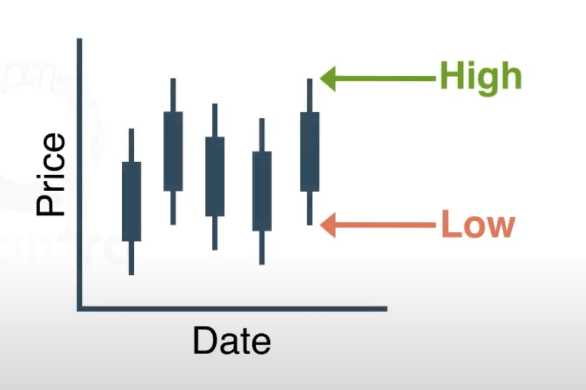
The Parkinson estimator was created to capture the true volatility of an asset by using its high and low prices. You will begin by understanding the formula and applying it to estimate the asset’s volatility. Further, you will compare the volatility values of the Parkinson as well as Close-to-Close estimators.Parkinson Estimator2m 57sSolution to Close-to-Close Estimator Issue5mEvaluation of Parkinson Estimator5mVolatility Comparison in Night and Day5mLimitation of Parkinson Estimator5mIncorporation of High and Low Prices5mParkinson Estimator of Volatility5mLog of High Over Low Values5mVolatility Using Parkinson Estimator5mAdditional Reading2m- Garman-Klass EstimatorWe have seen that both the close-to-close volatility estimator and the Parkinson estimator are not perfect. The Garman-Klass estimator attempts to address these problems by combining closing prices and the intra-day extremes. This section covers the need for the Garman-Klass estimator and the benefits and drawbacks of using it.Garman-Klass Estimator1m 53sLimitation of Close-To-Close Estimator5mAddressing the Limitations5mMultiple Estimators5mCombining Multiple Estimators5mBiasness of Garman-Klass Estimator5mWeighting Factors in Garman-Klass Estimator5mLimitation of Parkinson Estimator5mGarman-Klass Estimator of Volatility5mAdditional Reading for Garman-Klass Estimator2m
- Volatility EstimatorsWhile there is no universally superior estimator, understanding the characteristics and differences between these estimators will provide valuable insights into volatility estimation methods. Therefore, in this section, you will be taken through a quick comparison between three estimators i.e., the Parkinson estimator, the Close-to-Close estimator, and the Garman-Klass estimator.Volatility Estimators: Comparison3m 4sParkinson vs Close-to-Close5mIndication of the Parkinson Estimator5mDay and Night Volatility5mGarman-Klass, Close-to-Close, and Parkinson5mComparing Volatility Estimators5mAdditional Reading on Volatility Estimators2mFAQs on Volatility Estimation2mOverview2mTest on Volatility Estimators12m
Volatility Forecasting
GARCH (Generalized Autoregressive Conditional Heteroskedasticity) models are widely used for volatility forecasting in financial time series analysis. This section explains the characteristics of volatility used for forecasting and describes the application of the GARCH(1,1) model for volatility forecasting.Searching for Edge3m 1sIntroduction to Volatility Prediction3m 41sEmpirical Regularities of Volatility5mEfficient Market Hypothesis5mViolation of Efficient Market Hypothesis5mImportance of Volatility Prediction5mVolatility Forecasts and Profit5mLimitations of Volatility Prediction5mGARCH Model for Volatility Prediction3m 6sApplication of GARCH model5mCharacteristic of Volatility5mVolatility Characteristics Used by GARCH Models5mThe Equation for The GARCH(1,1) Model5mSigma Squared t5mParameter Estimation of the GARCH Model5mLog-Likelihood Function5mThe GARCH Forecast2mGARCH Parameters Estimation and Volatility Forecast5mEstimate GARCH(1,1) Parameters5mForecast Volatility Using GARCH(1,1) Model5mTrading with GARCH Forecast5mSuitable Condition to Buy a Straddle5mSuitable Condition to Sell a Straddle5mBacktest and Trade Level Analytics of GARCH Forecast5mOpen a Long Strangle Position During the Backtest5mAdditional Reading on GARCH Model2mFAQs on Volatility Forecasting2mHow to Trade Variance Premium
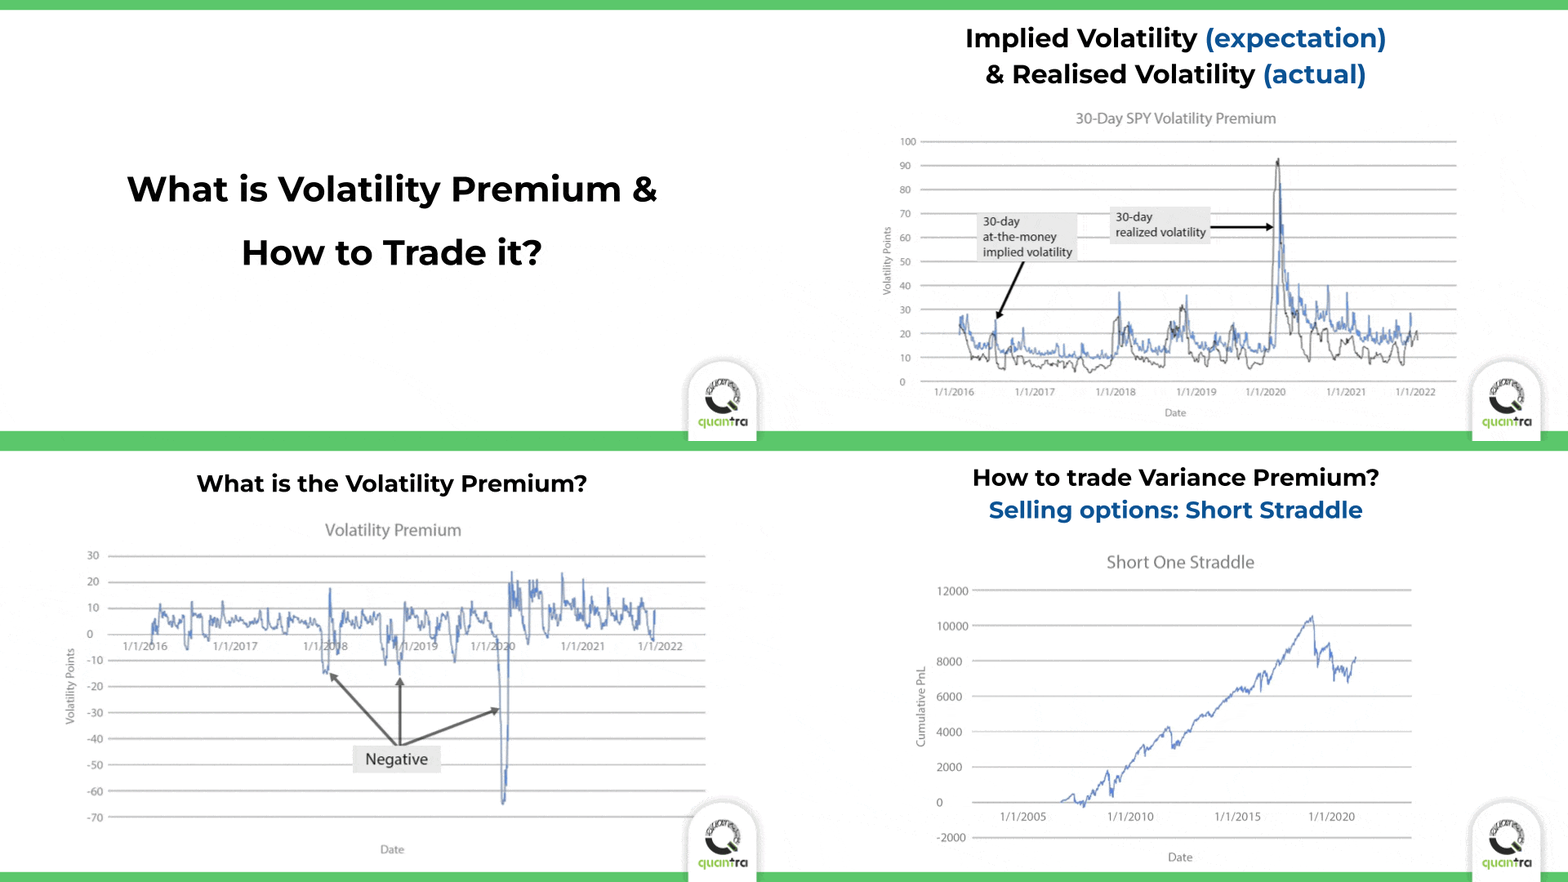
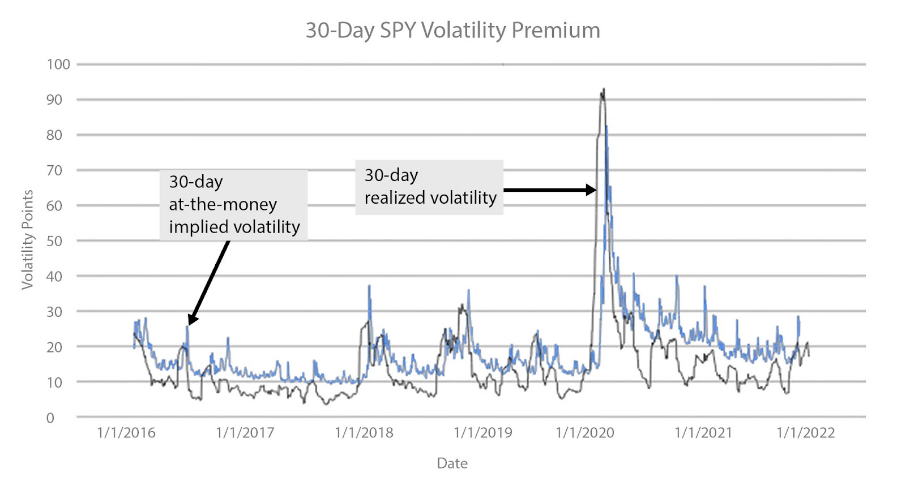
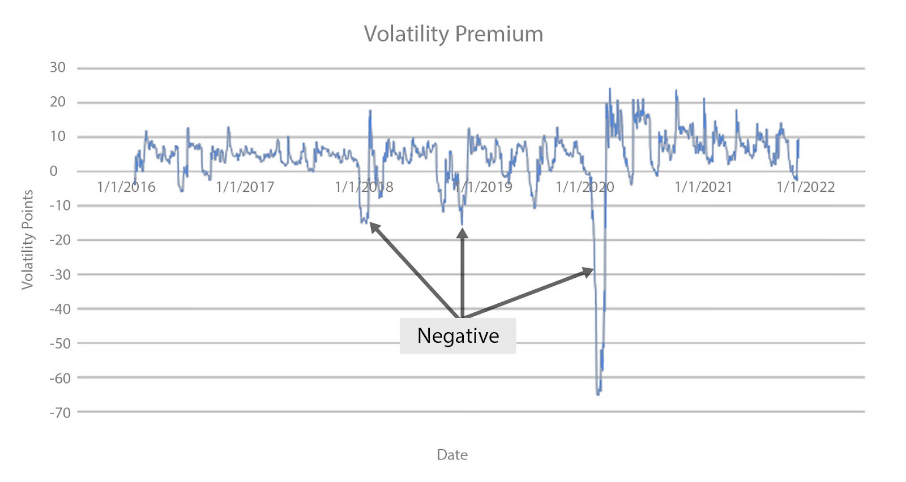
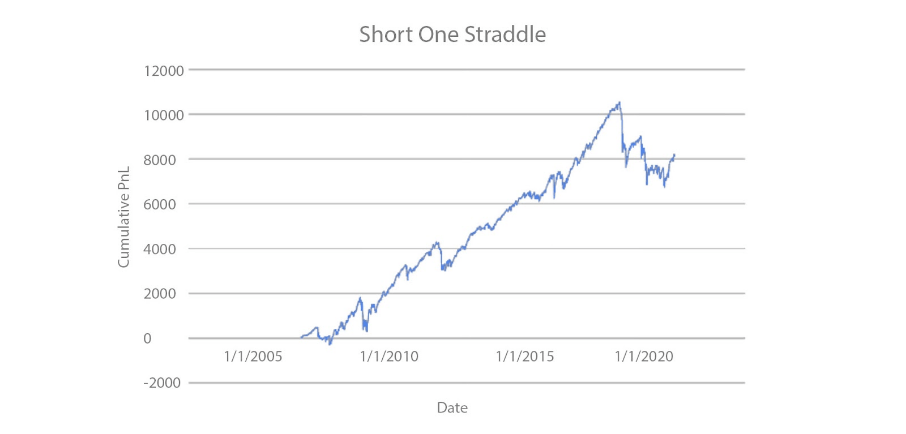
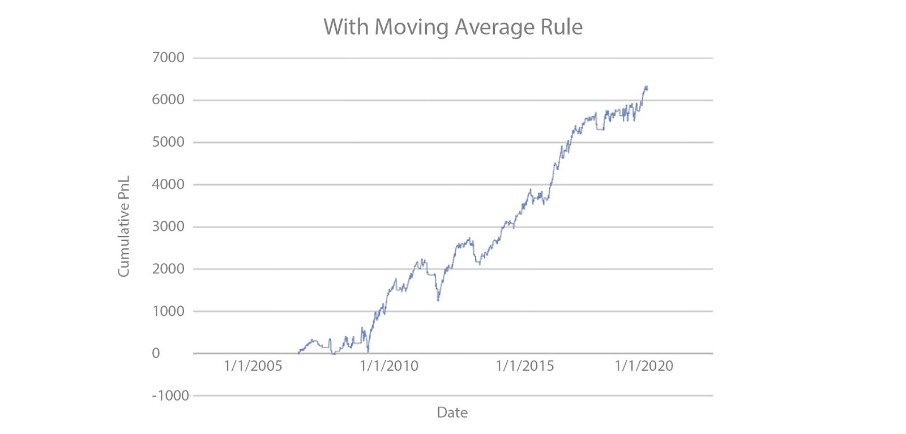
It is seen that people always volatility will be higher in the future than it actually turns out. In this section, you will see evidence of how implied volatility can be higher than the actual realised volatility. Further, you will apply this knowledge to create your own trading strategy and analyse its performance.Variance Premium2mDefinition of Variance Premium5mGeneration of Gains Using Variance Premium5mDifference Between Implied and Realised Volatility5mVisualisation of Volatility Premium5mImpact of Low Volatility on Volatility Premium5mImportance of Variance Premium5mComparison of Implied and Realised Volatility5mEdge and Variance Premium5mReason for Existence of Variance Premium2m 22sProperties of Volatility Premium5mConsequences of Belief in Recurrence of Black Swans5mExistence of Variance Premium5mShort Straddle and Variance Premium5mImprovement of Variance Premium Strategy5mBacktest Short Straddle Strategy5mDeduction of Day of the Week5mBacktest Short Straddle Strategy with VIX5mCalculate VIX Moving Average5mComparison of VIX with Moving Average of VIX5mAdditional Reading2mFAQs2m- P/L Distribution of Options StrategiesThe traditional way of analysing options strategies with payoff diagrams has its own limitations. The study of P/L distribution of options strategies not only overcomes these limitations but also opens doors for probabilistic analysis of profit or loss outcomes of options strategies. This section covered the concept behind the P/L distribution and details the Python implementation of the same. It includes techniques like Geometric Brownian Motion and Monte Carlo simulation to generate the P/L distribution of options strategies.Need To Study The P/L Distribution Of Options Strategies4m 50sThe Limitation of Payoff Analysis5mThe Objective of the Payoff Plot5mP/L Distribution vs Payoff Plot5mP/L Distribution of Options Strategies5mOptions Strategies and P/L Distribution5mSection Overview: P/L Distribution of Options Strategies3m 31sGenerate the P/L Distribution of Options Strategies5mNeed for Geometric Brownian Motion5mThe Objective of P/L Distribution of Options Strategies5mSummary Statistics of the P/L Distribution5mPurpose of Calculating the P/L5mGeometric Brownian Motion and Its Application2mGeometric Brownian Motion5mCalculate the Terminal Price5mSet the Random Seed5mAdditional Reading on Geometric Brownian Motion2mFAQs on PL Distribution of Options Strategies2m
Monte Carlo Simulation
Simulation of multiple price paths is not easy. It should be random but it has to follow certain rules. Understand how Monte Carlo simulations help us simulate various paths and how they can be used in trading.Need for Monte Carlo Simulations2m 14sSimulation Versus Backtest5mDefinition of Monte Carlo Simulation5mPurpose of Monte Carlo Simulation5mInference of Results5mMonte Carlo Simulation in Trading2m 25sApplication of Monte Carlo Simulation in Trading5mPrediction of Volatility and Success in Options Trading5mAbility of Monte Carlo Simulation and Simulation of Multiple Price Paths5mChallenges in Options Trading Strategy Backtesting5mMonte Carlo Simulator with GBM5mStudy Stock Price Behaviour5mMonte Carlo Simulation with Geometric Brownian Motion5mMonte Carlo Simulator for Long Strangles5mNeed to Use Monte Carlo Simulator for Long Strangle5mPL Distributions of Multiple Strategies5mFAQs2mTest on Volatility Forecasting and Trading14m- Practical HedgingIn this section, you will acknowledge the reason for hedging and also explain why it is not always practical to hedge.Practicalities of Hedging4m 49sHedging and Money5mHedging and its Use5mPurpose of Hedging5mConsideration of Factors in Hedging5mHedging and Profit-Loss Distribution5mOverview2m
- Capstone ProjectIn this section, you will apply the knowledge you have gained in the course. You will pick up a capstone project where you will use the average of Close-to-close, Parkinson and Graman-Klass volatility estimates to forecast the volatility using the GARCH(1,1) model. Furthermore, you will backtest an options trading strategy based on the forecasted volatility.Getting Started2mProblem Statement2mCode Template and Data Files2mCapstone Solution Downloadable2m
- Live Trading on IBridgePyIn this section, you would go through the different processes and API methods to build your own trading strategy for the live markets, and take it live as well.Uninterrupted Learning Journey with Quantra2mSection Overview2m 2sLive Trading Overview2m 41sVectorised vs Event Driven2mProcess in Live Trading2mReal-Time Data Source2mCode Structure2m 15sAPI Methods10mSchedule Strategy Logic2mFetch Historical Data2mPlace Orders2mIBridgePy Course Link10mAdditional Reading10mFrequently Asked Questions10m
- Paper and Live TradingTo make sure that you can use your learning from the course in the live markets, a live trading template has been created which can be used to paper trade and analyse its performance. This template can be used as a starting point to create your very own unique trading strategy.Template Documentation10mTemplate Code File2m
- Run Codes Locally on Your MachineIn this section, you will learn to install the Python environment on your local machine. You will also learn about some common problems while installing python and how to troubleshoot them.Python Installation Overview1m 59sFlow Diagram10mInstall Anaconda on Windows10mInstall Anaconda on Mac10mKnow your Current Environment2mTroubleshooting Anaconda Installation Problems10mCreating a Python Environment10mChanging Environments2mQuantra Environment2mTroubleshooting Tips for Setting Up Environment10mHow to Run Files in Downloadable Section?10mTroubleshooting for Running Files in Downloadable Section10m
- SummaryIn this section, we will summarise everything you have learned in this course.Conclusion and Q/A2mCourse Summary2m 44sCourse Summary and Next Steps2mPython Codes and Data2m
Registered Successfully!
You will receive webinar joining details on your registered email
Would you like to start learning immediately?
about author


Why quantra®?
- More in Less Time
Gain more in less time
- Expert Faculty
Get taught by practitioners
- Self-paced
Learn at your own pace
- Data & Strategy Models
Get data & strategy models to practice on your own
Faqs
- When will I have access to the course content, including videos and strategies?
You will gain access to the entire course content including videos and strategies, as soon as you complete the payment and successfully enroll in the course.
- Will I get a certificate at the completion of the course?
Yes, you will be awarded with a certification from QuantInsti after successfully completing the online learning units.
- Are there any webinars, live or classroom sessions available in the course?
No, there are no live or classroom sessions in the course. You can ask your queries on community and get responses from fellow learners and faculty members.
- Is there any support available after I purchase the course?
Yes, you can ask your queries related to the course on the community: https://quantra.quantinsti.com/community
- What are the system requirements to do this course?
Fast-speed internet connection and a browser application are required for this course. For best experience, use Chrome.
- What is the admission criteria?
There is no admission criterion. You are recommended to go through the prerequisites section and be aware of skill sets gained and required to learn most from the course.
- Is there a refund available?
We respect your time, and hence, we offer concise but effective short-term courses created under professional guidance. We try to offer the most value within the shortest time. There are a few courses on Quantra which are free of cost. Please check the price of the course before enrolling in it. Once a purchase is made, we offer complete course content. For paid courses, we follow a 'no refund' policy.
- Is the course downloadable?
Some of the course material is downloadable such as Python notebooks with strategy codes. We also guide you how to use these codes on your own system to practice further.
- Can the python strategies provided in the course be immediately used for trading?
We focus on teaching these quantitative and machine learning techniques and how learners can use them for developing their own strategies. You may or may not be able to directly use them in your own system. Please do note that we are not advising or offering any trading/investment services. The strategies are used for learning & understanding purposes and we don't take any responsibility for the performance or any profit or losses that using these techniques results in.
- I want to develop my own algorithmic trading strategy. Can I use a Quantra course notebook for the same?
Quantra environment is a zero-installation solution to get beginners to start off with coding in Python. While learning you won't have to download or install anything! However, if you wish to later implement the learning on your system, you can definitely do that. All the notebooks in the Quantra portal are available for download at the end of each course and they can be run in the local system just the same as they run in the portal. The user can modify/tweak/rework all such code files as per his need. We encourage you to implement different concepts learnt from different learning tracks into your trading strategy to make it more suited to the real-world scenario.
- If I plug in the Quantra code to my trading system, am I sure to make money?
No. We provide you guidance on how to create strategy using different techniques and indicators, but no strategy is plug and play. A lot of effort is required to backtest any strategy, after which we fine-tune the strategy parameters and see the performance on paper trading before we finally implement the live execution of trades.
- What does "lifetime access" mean?
Lifetime access means that once you enroll in the course, you will have unlimited access to all course materials, including videos, resources, readings, and other learning materials for as long as the course remains available online. There are no time limits or expiration dates on your access, allowing you to learn at your own pace and revisit the content whenever you need it, even after you've completed the course. It's important to note that "lifetime" refers to the lifetime of the course itself—if the platform or course is discontinued for any reason, we will inform you in advance. This will allow you enough time to download or access any course materials you need for future use.
- What is implied volatility in options?
Implied volatility is a measure of how much the price of an option is expected to change in the future. It is calculated using the price of the option, the strike price, the time to expiration, and the risk-free interest rate. Implied volatility is an important factor in pricing options, as it reflects the market's expectation of how much the underlying asset's price will fluctuate.
- What is option volatility?
Option volatility refers to the extent to which the prices of options can vary. It reflects the market's anticipation of how much the underlying asset's price might change and the associated level of risk involved. When option volatility is high, it indicates greater uncertainty, while low volatility suggests more predictable price movements. The level of option volatility directly impacts options prices and influences the strategies traders employ to take advantage of potential price fluctuations.
- Is volatility good for options?
Volatility can be good for options traders if they are able to correctly predict the direction of the underlying asset's price. For example, if a trader believes that a stock is going to go up in price, they can buy a call option. If the stock does go up in price, the trader will make a profit.
- Which indicator is best for volatility?
There is no single best indicator for volatility, as the best choice will depend on the specific market being analyzed and the preferences of the trader or analyst. Different indicators may provide different insights and have their own strengths and weaknesses.
The most commonly used indicators are:- Bollinger Bands: Bollinger Bands are a volatility indicator that uses a moving average and standard deviation to create a series of bands around the price of a security. The width of the bands indicates the level of volatility, with wider bands indicating higher volatility and narrower bands indicating lower volatility.
- Average True Range (ATR): ATR is a charting indicator that calculates the average price range between high and low prices of a security over a specific period. The higher the ATR, the higher the volatility.
- Cboe Volatility Index (VIX): The VIX is a volatility index that measures the implied volatility of S&P 500 options. The VIX is often used as a measure of overall market volatility.
- What are the types of volatility?
- Historical Volatility (HV): Historical volatility measures the actual price fluctuations of an asset over a specific period based on past price data.
- Implied Volatility (IV): Implied volatility reflects the market's expectations of future price movements and is derived from options prices.
- Realised Volatility (RV): Realised volatility calculates the actual volatility experienced by an asset over a given period using historical price data.
- How to calculate volatility?
The simplest approach to determine the historical volatility of a security is to calculate the standard deviation of its prices over a period of time.
To calculate implied volatility, you will need to know the market price of the option, the strike price of the option, the time to expiration of the option, and the risk-free interest rate. You can then use an option pricing model, such as the Black-Scholes model, to calculate the implied volatility.
- What are options volatility strategies?
There are a number of options volatility strategies that can be used to profit from changes in implied volatility. Some of the most common strategies include:
- Straddle: A straddle strategy involves buying a call and a put option (Long straddle) or selling a call and a put option (Short straddle) with the same strike price and expiration date.
- Butterfly: A butterfly spread involves buying one call and one put option with one strike price, and selling two calls and two put options with a different strike price. This strategy profits if the underlying asset's price stays within a certain range.
- Iron Condor: An iron condor is similar to a butterfly spread, but the call and put options have different expiration dates. This strategy is less risky than a butterfly spread, but it also has less potential profit. Traders implement this strategy when they expect the price to remain range-bound with low volatility.
- Ratio Spread: A ratio spread involves buying or selling a certain number of call or put options with one strike price and selling or buying a different number of call or put options with a different strike price. This strategy can be used to profit from changes in implied volatility or changes in the underlying asset's price.
- What is a high implied volatility for options?
When trading individual stocks, implied volatility (IV) rank or percentile above 50% is typically considered sufficiently high to implement strategies that benefit from a decrease in implied volatility.
For trading the SPX index or discussing the overall market, a VIX reading above 20 is generally regarded as high.
- How does volatility affect option pricing?
Volatility significantly impacts option pricing through its influence on the option premium. Higher volatility increases the likelihood of large price movements, making both call and put options more valuable. This is reflected in the "implied volatility" component of an option's price.
- What are the advantages and disadvantages of Options Volatility Trading?
The major advantage is that traders can benefit from predicting changes in volatility, regardless of whether the market moves up or down. Strategies like straddles or strangles allow you to profit in volatile conditions without guessing the direction of price movement. You can also use options as a hedge against unexpected volatility in other positions.
The major disadvantage is that volatility is not the only factor which influences the option prices. You have to account for theta decay as well.