Normal Distribution
A normal distribution looks like a bell-shaped curve. It is a symmetric distribution with two parameters: mean and standard deviation.
You can see the visual representation of Normal Distribution in the chart below.
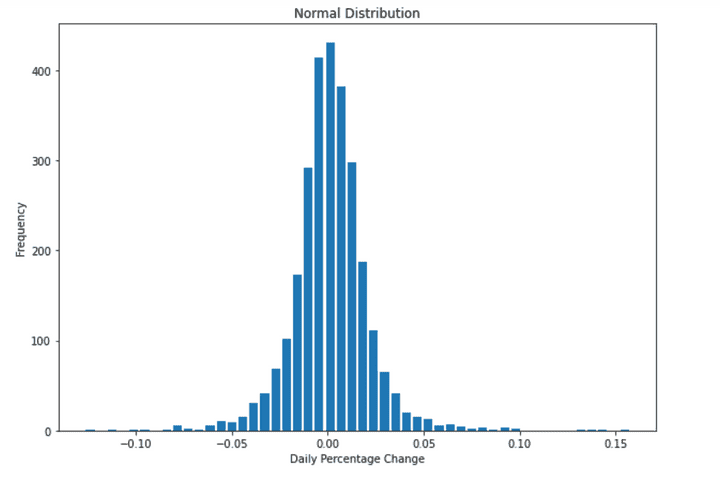
The majority of data lies in the middle and the mean divides the data in half. The mean can be interpreted as the expected percentage change for the stock and the standard deviation as the risk associated with investing in this stock.
As the returns are normally distributed for this data set, we can calculate the minimum and maximum values or the range for the returns. This makes the improbable a bit more probable.
RELATED KEYWORDS
