How to Trade a Breakout Strategy using Bollinger Bands?
Have you ever monitored a stock in a breakout? Well if you have, you’d know that it’s challenging to pinpoint an entry position after the stock has entered the breakout phase. There are so many moving pieces - it is highly volatile, there’s always a risk of entering too late, and finding the right exit point without any loss of profit or being exposed to a trend reversal can be quite a challenge.
Technical indicators, if used correctly, could help you in managing this situation. But how can you figure out the sweet spot that could help you make the most out of a breakout? Well, you’re about to find out!

Note that backtesting results do not guarantee future performance. The presented strategy results are intended solely for educational purposes and should not be interpreted as investment advice.
In this post we will create a breakout strategy to find out the best entry and exits using Bollinger Bands. This is a bit different than the conventional method of using Bollinger Bands because in this strategy we will focus on different phases of Bollinger Bands. This post will take you through the step-by-step process of creating the strategy, backtesting it, and analysing its performance - all with the help of Python. If you are new to Python, you can take a look at Quantra’s free course on Python for Trading: Basic.
The following topics are covered in this post:
- What are Bollinger Bands?
- What are Bollinger Band phases and what do they tell us?
- Create a breakout strategy using Bollinger Band phases
- Backtesting the strategy
- Analysing the strategy’s performance
What are Bollinger Bands?
Bollinger Bands are price envelopes that represent the price and volatility of an asset. Bollinger Bands have three components: Middle band, upper band, and lower band. This is what they look like:
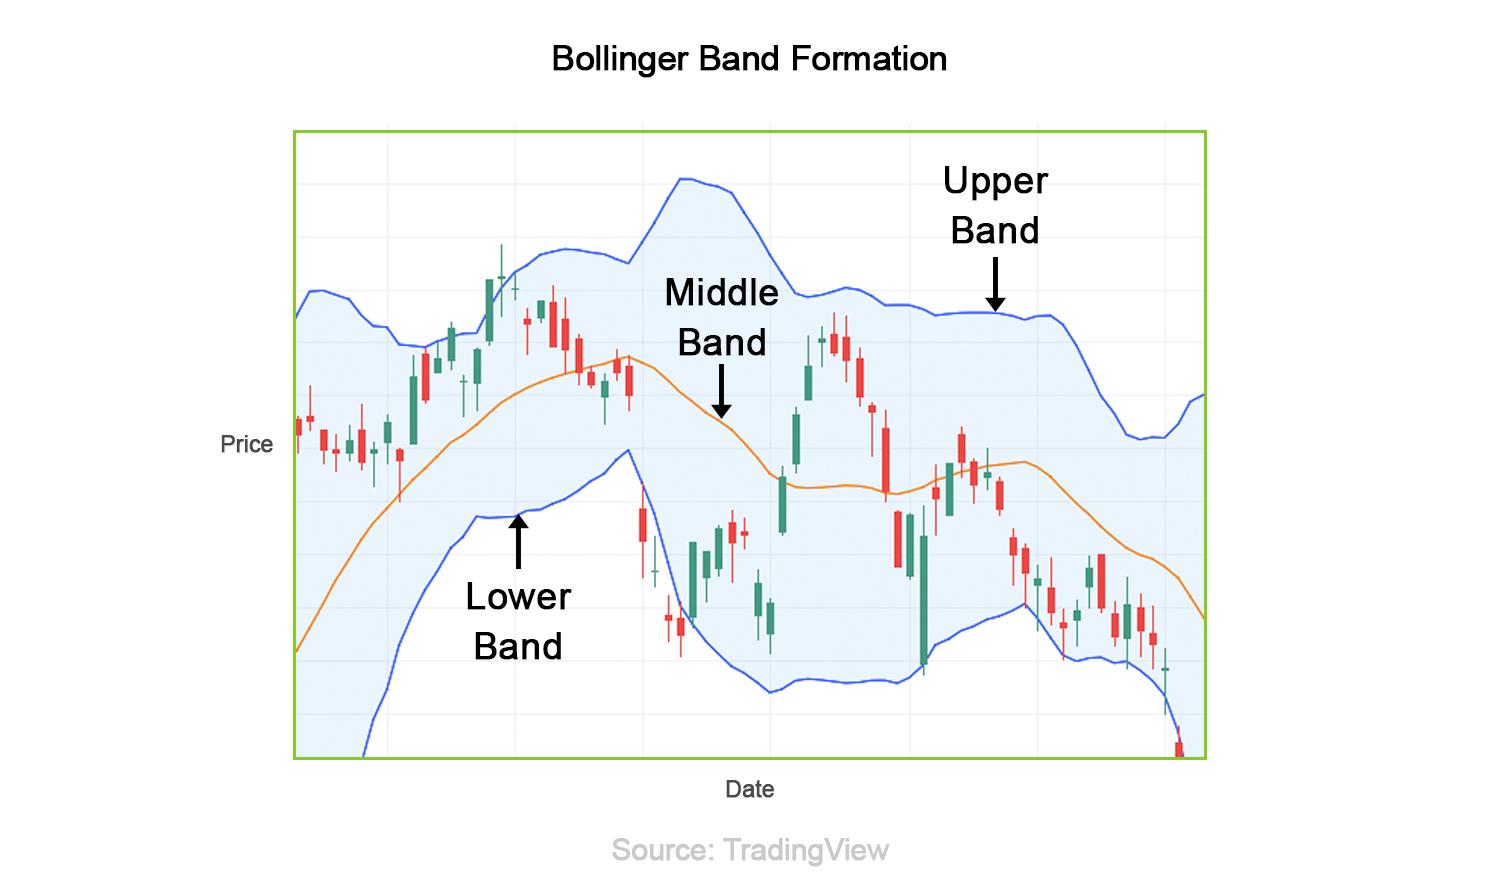
If the price of a stock moves above the upper band it indicates an overbought condition, if it moves below the lower band it indicates an oversold condition. The most basic strategy that we can create using Bollinger Bands is to buy when the price is near the lower band and sell when it's near the upper band. But, the issue here is that if the stock is witnessing an upward breakout for instance, then the price will always be near the upper band:
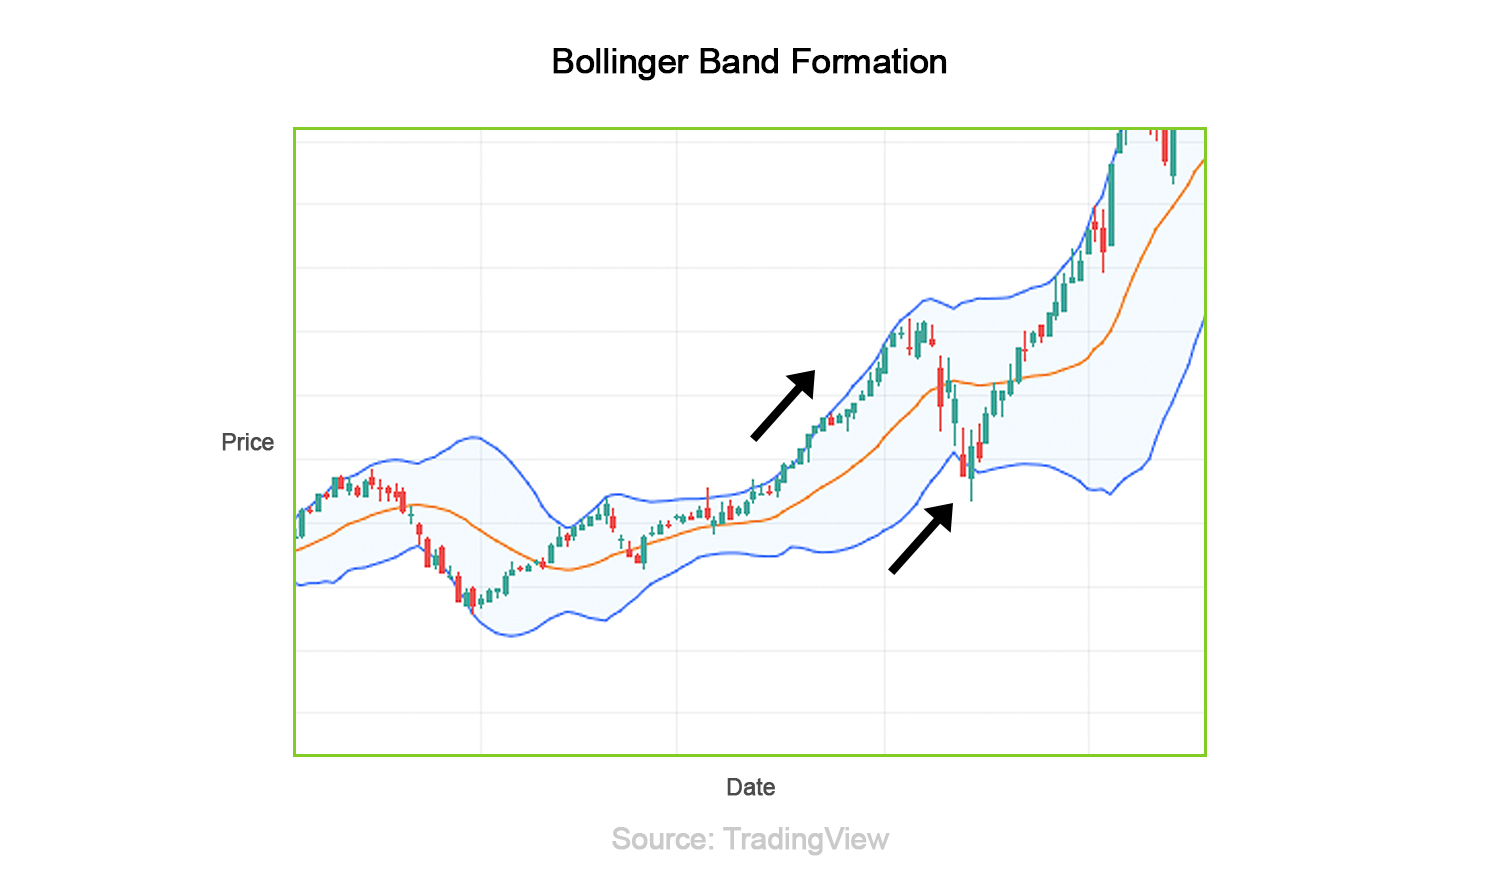
In the plot above, you can see that the prices are closely moving with the upper band. In this case, if we sell, we would miss out on a major uptrend. So what’s the solution? Well, the Bollinger Bands are more than what simply meets the eye. They depict something that we call “phases” and by analysing these phases and their bandwidth, you can set the right entry/exit points while trading a breakout. Let’s move ahead and find out what these phases and bandwidths are.
What is Bollinger Bandwidth?
Bollinger bandwidth is calculated as:
Bollinger Bandwidth = Upper Band - Lower BandMiddle Band
The change in bandwidth represents the change in price volatility and we are going to need the bandwidth information to create our strategy. Usually, you don’t have to worry about calculating the bandwidth because it is available as a technical analysis indicator in many charting platforms.
What are Bollinger Band phases and what do they tell us?
The volatility of a stock or broad market moves in cycles. These cycles can be identified with the help of the different phases of Bollinger Bands. There are four Bollinger Band phases. Bollinger squeeze, Bollinger expansion, Bollinger continuation, Bollinger contraction.
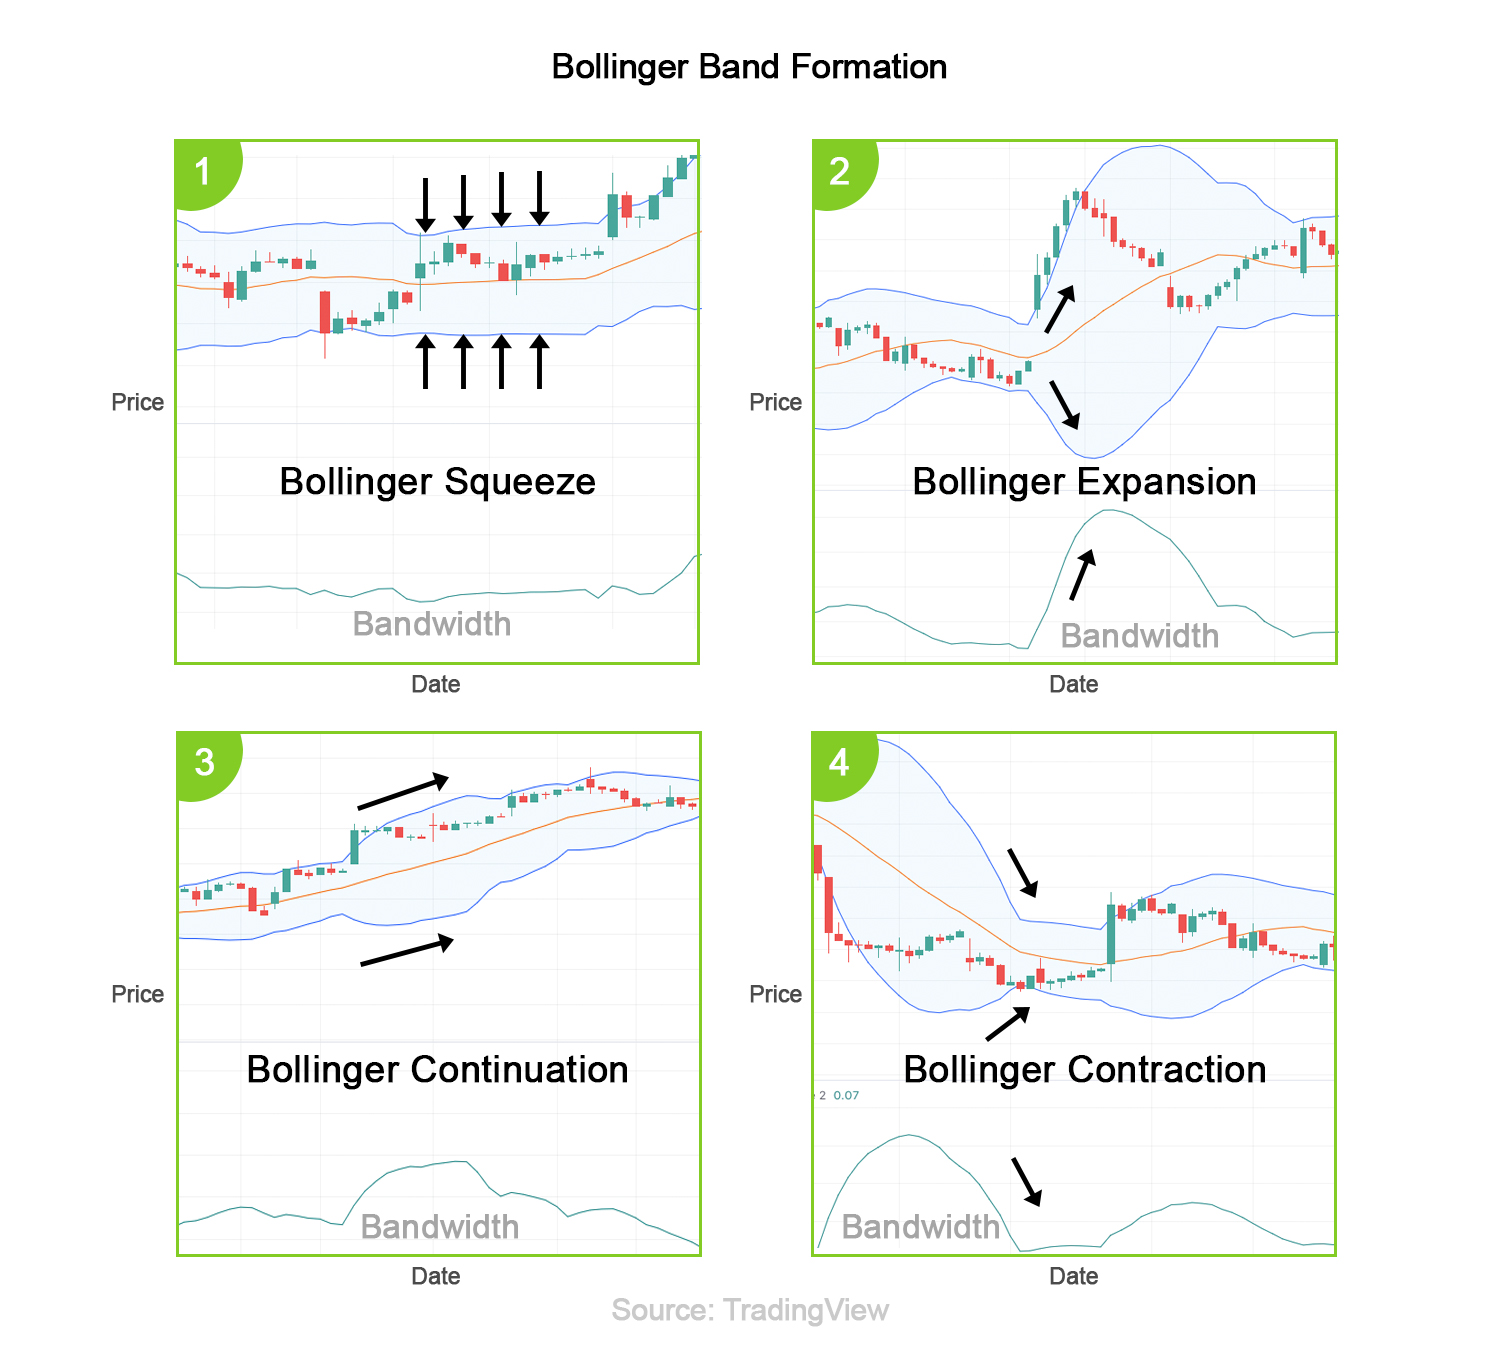
- Bollinger squeeze: Prices are consolidated in a trading range. The Bands are flat and the bandwidth will be constant with a lower reading. This indicates an extremely low volatile phase of the market.
- Bollinger expansion: Upper band and lower band diverge. Bollinger expansion is characterised by a gradual increase in the bandwidth representing a gradual increase in the volatility. The middle band also moves in the direction of the trend. This indicates a possible start of a trend.
- Bollinger continuation: All bands are parallel and move in the same direction. Bollinger continuation is observed when the trend is mature and stable. This is characterised by high bandwidth reading and high volatility
- Bollinger contraction: Upper band and lower bands converge. Bollinger contraction is characterised by a gradual decrease in the bandwidth representing a gradual decrease in the volatility. The middle band stops to trend and starts to flatten. This indicates a possible end of a trend.
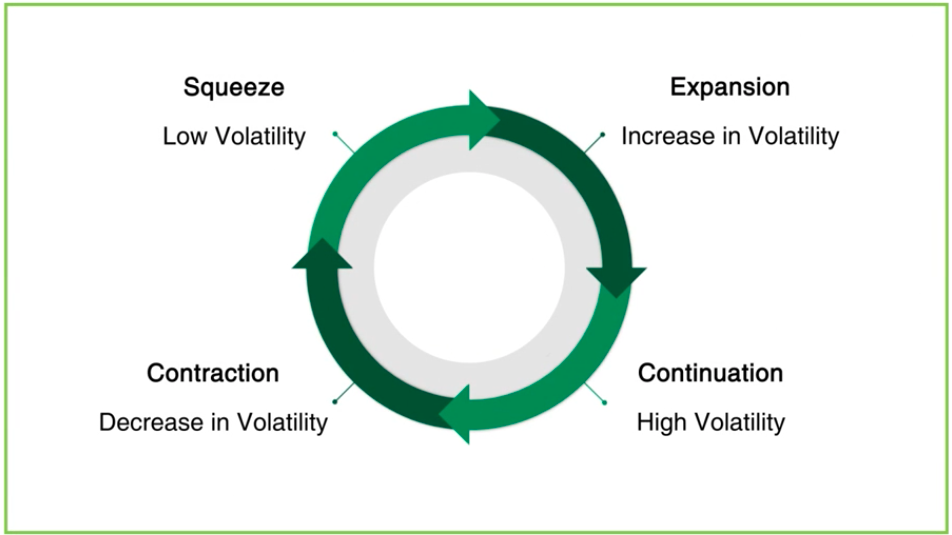
In this way, the volatility cycles can be studied using the Bollinger Band phases and the change in Bollinger bandwidth. As shown in the chart below, the Bollinger squeeze phase will be followed by the Bollinger expansion, continuation and contraction phases completing one volatility cycle. The next volatility cycle starts with a gradual increase in the volatility i.e. Bollinger expansion and ends with a low volatile phase i.e. Bollinger squeeze phase.
All the concepts covered in this post are taken from the Quantra course Volatility Trading Strategies. You can preview the concepts taught in this post by clicking on the free preview button and going to Section 11 and Unit 1 of the course.
Note: The links in this tutorial will be accessible only after logging into quantra.quantinsti.com
Create a breakout strategy using Bollinger Band phases
If we want to trade a breakout then we have to spot the beginning of a trend and enter right where it starts, or at least somewhere close. This way we’ll be able to hold the trade for longer and ride out the trend in our favour. Ideally, we should also exit just before the end of a trend.
Pre-entry:
Identify a Bollinger squeeze phase. Here, the Bands are parallel to each other and flat. The volatility, which is shown by the Bollinger bandwidth, should also be low.
Long entry conditions:
1. There is an increase in buying pressure indicated by bollinger expansion
2. There is an increase in volatility indicated by an increase in bandwidth.
3. The middle band should start trending higher.
4. The high of the candle should be above the upper band.
Long exit conditions:
- Wait till the price goes down to the middle band
OR
- Wait till the trend dies out. That is, wait for the Bollinger contraction phase
How to backtest this strategy?
To backtest this strategy you can calculate the Bollinger Bands, identify its phases, and generate trading signals - all with the help of Python. You can also backtest this strategy to check how it has performed on past data. We backtested this strategy on the Moderna stock and these were the strategy returns over three years:
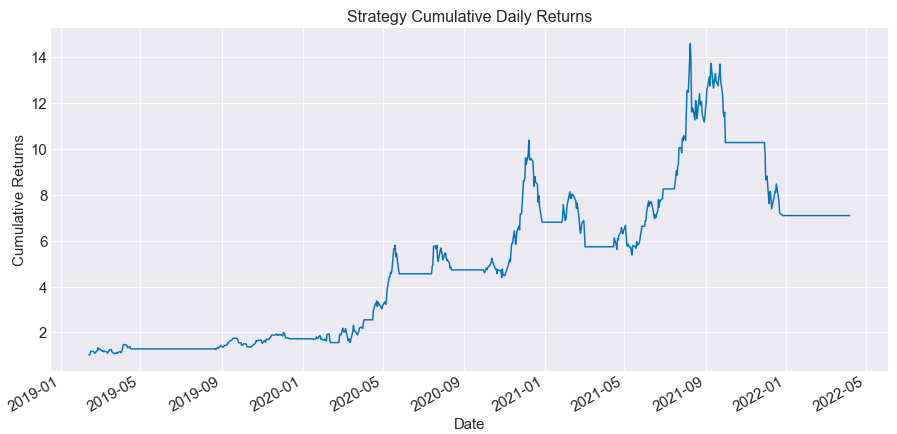
Note that backtesting results do not guarantee future performance. The presented strategy results are intended solely for educational purposes and should not be interpreted as investment advice.
The Python code for creating and backtesting this strategy can be found in this unit of the Volatility Trading Strategies course. You need to take a Free Preview of the course by clicking on the green-coloured Free Preview button on the right corner of the screen next to the FAQs tab and go to Section 22 and Unit 6 of the course.
What to do next?
- Go to this course
- Click on
- Go through 10-15% of course content
- Drop us your comments and queries on the community

IMPORTANT DISCLAIMER: This post is for educational purposes only and is not a solicitation or recommendation to buy or sell any securities. Investing in financial markets involves risks and you should seek the advice of a licensed financial advisor before making any investment decisions. Your investment decisions are solely your responsibility. The information provided is based on publicly available data and our own analysis, and we do not guarantee its accuracy or completeness. By no means is this communication sent as the licensed equity analysts or financial advisors and it should not be construed as professional advice or a recommendation to buy or sell any securities or any other kind of asset


