How to Identify Trending Stocks from S&P 500?
Have you ever wondered if you could screen hundreds of stocks, like the stocks in the S&P 500 and choose the top 20 positively trending stocks?
Well, you are in the right place! Today, you will learn to harness the power of Python to screen stocks using multiple indicators! And all this in a few minutes.
In this post, we will discuss an approach to set certain conditions so that we can screen the stocks from the S&P 500 index and keep only those stocks which meet your criteria.
If you want to run or download the Python code to see how we have used three technical indicators to identify the top 20 trending stocks, click the button below, click on the free preview button and go to Section 31 and Unit 4 of the course.

All the concepts covered in this post are taken from the Quantra course Technical Indicators Strategies in Python. You can preview the concepts taught in this post by clicking on the free preview button and going to Section 31 and Unit 4 of the course.
Note: The links in this tutorial will be accessible only after logging into quantra.quantinsti.com
In this post, we will cover the following topics:
- Process of Screening
- Get Stock Data
- Select Technical Indicators
- How to Rank Stocks
- Evaluate the Final List
The Technical Indicators Strategies in Python course will help you use technical indicators to generate trading signals and identify trends in an asset’s price.
Process of Screening
Before we begin our screening process, let us go through an overview of the screening process.
- Get stock data: You can get any number of stocks’ OHLCV data which you want to screen. For this post, we will be using the OHLCV data of the constituents of the S&P 500 index.
- Select technical indicators used for screening: You need certain filters or criteria for screening the top stocks. Here, you are trying to identify the top 20 trending stocks. To help you with the screening process, you can use technical indicators like ADX, moving averages, Chaikin oscillators etc.
- Rank the stocks based on indicator values: Once the technical indicator values are calculated, you will rank them on a scale from 1 to n, where n is the total number of stocks you are using. Here, the ranking will help us standardise all technical indicator values.
- Give a final score to the stocks: Based on the rank, you can give a final score to the stocks. To make sure that all indicator values are given equal weightage, you will simply average the ranks.
- Choose the top 20 stocks: Using the final score, you will select the top 20 stocks which are trending.
Get Stock Data
Before you apply a filter or a screener, you should always make sure you have the required data you would need for this project. When it comes to individual stock price data, you can easily use various data providers and start working on your project.
In this post, you are going to use the stock price data of the constituents of the S&P 500.
To download the data for all the assets that make up the S&P 500, you will first need the ticker of all the assets. You can find the list on various websites, including Wikipedia. You can read this information from a web source by using the `read_html` method of pandas.
To know more on how to download S&P 500 index constituents OHLCV data and store the OHLCV data in your local system, try out the notebook in section 2 unit 4 of the course Getting Market Data: Stocks, Crypto, News & Fundamental.

Note: The links in this tutorial will be accessible only after logging into quantra.quantinsti.com
Select Technical Indicators
Let’s assume you are using the ADX indicator, which tells you the strength of a trend. If it is above 25, it means the asset is trending.
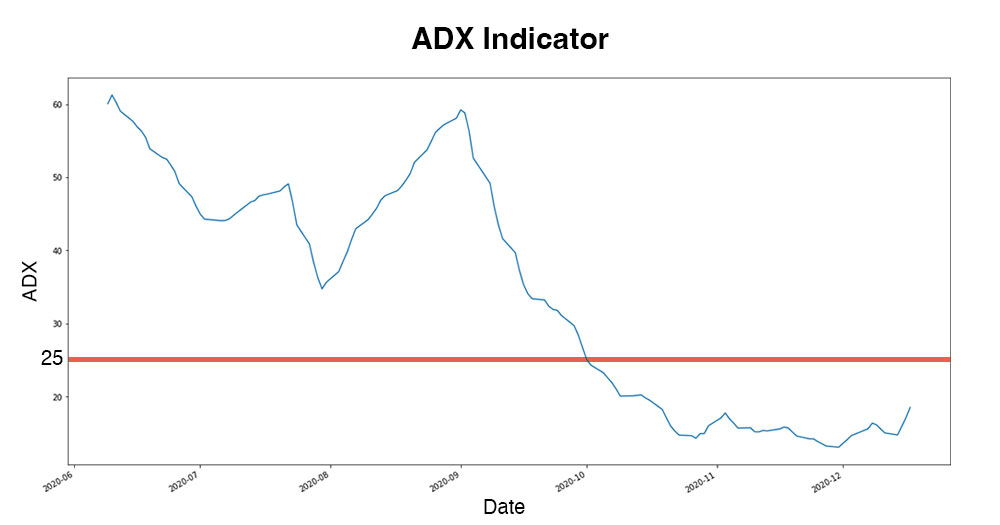
Figure: ADX Indicator
You can see that till September 2020, the ADX was above 25. This means that the asset is trending in that period. Since ADX only tells us the strength and not the direction of the trend, we will use the positive direction indicator as well. And we will only consider those stocks which have a positive trend. Note that for screening, we are not going to use ADX as a threshold but to score all the assets in the index.
But we have used only one indicator so far.
You can have any number of indicators for screening the stocks! Apart from ADX, you can use the Chaikin oscillator and the moving averages too! If you are wondering how to code the indicators in Python, you can click the below button and go through the Python notebook where we have used three indicators, screened and chose the top 20 positively trending stocks.
Note: This notebook will be in “Free Preview” for a limited time only. So make sure you go through the notebook as soon as possible.
Note: The link will be accessible only after logging into quantra.quantinsti.com.
How to Rank Stocks?
You have decided to use three technical indicators
- ADX Indicator
- Chaikin Oscillator
- Moving averages
ADX indicator and Chaikin Oscillator have a definite range of values. However, moving averages can have a wide range of values.
Tesla is priced at around $180 and Nvidia is priced at around $130. The moving average of Tesla will always be higher than Nvidia's, even though Tesla’s close price’s moving average is declining while Nvidia’s close price’s moving average is rising.
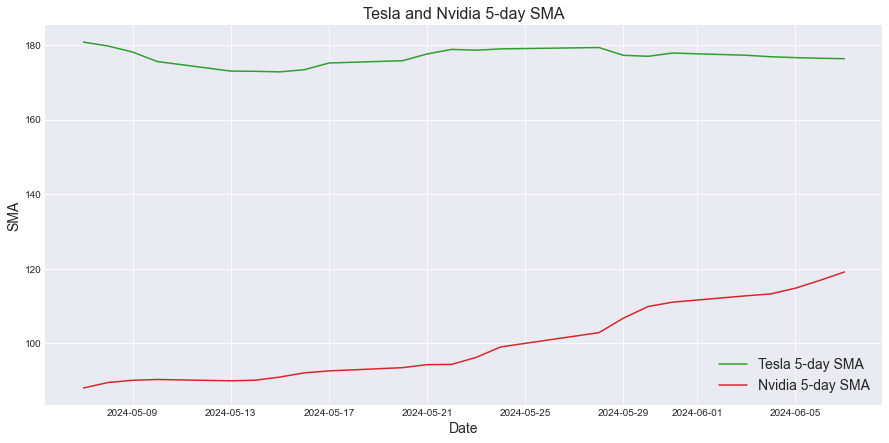
Figure: Tesla and Nvidia 5-day SMA
How do you solve this issue?
You standardise it!
In the case of moving averages, you can simply use two moving averages and divide the shorter moving average by the longer moving average.
If the shorter moving average is more than the longer moving average, then we will get a value of more than 1. This indicates an uptrend.
So you can just divide the shorter moving average, i.e. 14-day SMA by the longer moving average, i.e. 50-day SMA.
How should you give the score and select the top trending stocks?
Now that we have calculated the indicator values, we will move further in our quest to select the top 20 positively trending stocks. For this purpose, we will use the last day's data and rank the stocks according to their indicator values. Here, the idea is to assign the rank to the indicator value before we move forward to sort the companies according to their rank.
By default, if there are two identical values, then the rank will be an average of the ranks of those values.
For example, there are 5 stocks, A, B, C, D, and E, with stock prices as shown below:
|
Stock |
A |
B |
C |
D |
E |
|
Price |
1 |
2 |
3 |
3 |
5 |
Assume you have to rank them based on their price. Here, the higher the price, the higher will be the rank.
Stock E has the maximum price. Thus, its rank will be 5.
|
Stock |
A |
B |
C |
D |
E |
|
Price |
1 |
2 |
3 |
3 |
5 |
|
Rank |
5 |
Now, stocks C and D, both have the stock price of 3. Remember, the higher the price, the higher the rank. Here, we will take the average of the ranks they would have, i.e. the fourth and third ranks. Thus, (3+4)/2 = 3.5.
|
Stock |
A |
B |
C |
D |
E |
|
Price |
1 |
2 |
3 |
3 |
5 |
|
Rank |
3.5 |
3.5 |
5 |
Since the third and fourth ranks are given, stock B will be ranked 2 and stock A will be ranked 1. This is shown in the table below.
|
Stock |
A |
B |
C |
D |
E |
|
Price |
1 |
2 |
3 |
3 |
5 |
|
Rank |
1 |
2 |
3.5 |
3.5 |
5 |
Evaluate the Final List
Now we are going to assign scores to the stocks on the basis of their ranks. As we are giving equal weightage to all indicator values, we will calculate a simple average of the ranks of indicators and then sort the stocks in descending order of their scores.
For example, let’s take three stocks from the list of 500. Their indicator values are given below:
|
Indicator |
Apple |
Nvidia |
Tesla |
|
Normalised SMA Values |
0.02 |
0.025 |
-0.09 |
|
Chaikin Value |
-13 |
-4.4 |
5.4 |
|
ADX Indicator Value |
10.9 |
21 |
18.8 |
Note that these numbers are for illustration purposes only. Now, we will rank them based on their indicator values.
|
Indicator |
Apple |
Nvidia |
Tesla |
|
Normalised SMA Value Rank |
2 |
3 |
1 |
|
Chaikin Value Rank |
1 |
2 |
3 |
|
ADX Indicator Value Rank |
1 |
3 |
2 |
You can see that since Tesla had the lowest “Normalised SMA Value” of -0.09, it was given the lowest rank among the three for “Normalised SMA Value Rank”.
After taking the average values of all the indicators and rounding them to avoid decimal places, the table is as follows:
|
Indicator |
Apple |
Nvidia |
Tesla |
|
Normalised SMA Value Rank |
2 |
3 |
1 |
|
Chaikin Value Rank |
1 |
2 |
3 |
|
ADX Indicator Value Rank |
1 |
3 |
2 |
|
Average |
1.3 |
2.6 |
2 |
|
Final Rank |
1 |
3 |
2 |
Since Nvidia has the highest average value, it is said that it is the highest-trending stock among the three of them. In this example, we used the scores of three different stocks. In a similar manner, you will screen all the stocks of the S&P 500 and choose the top 20 positively trending stocks based on their average scores.
That’s all. You have screened hundreds of stocks on the basis of three technical indicators. Go ahead and try out what you have learned in this post by going through the notebook in section 31 unit 4 of the Technical Indicators Strategies in Python course.
Note: The link will be accessible only after logging into quantra.quantinsti.com.
What to do next?
Quantra’s All Courses Bundle offers a wide array of courses covering algorithmic and quantitative trading. These courses cover various options trading strategies, portfolio management, machine learning, and single asset strategies like mean reversion and momentum, and statistical tests. Take advantage of our limited-time 85% discount on Quantra’s All Courses Bundle today!
IMPORTANT DISCLAIMER: This post is for educational purposes only and is not a solicitation or recommendation to buy or sell any securities. Investing in financial markets involves risks and you should seek the advice of a licensed financial advisor before making any investment decisions. Your investment decisions are solely your responsibility. The information provided is based on publicly available data and our own analysis, and we do not guarantee its accuracy or completeness. By no means is this communication sent as the licensed equity analysts or financial advisors and it should not be construed as professional advice or a recommendation to buy or sell any securities or any other kind of asset.


