How to Use Probability Levels to Improve ML Model's Prediction?
While many traders dip their toes into backtesting strategies using machine learning, only a select few dare to dive deeper into refining and enhancing their models.
But how do you improve your machine learning model?
In today’s classroom, we will use the concept of setting probability thresholds in decision tree machine learning model to do just that. The
Machine Learning for Options Trading course of Quantra will let you apply cutting-edge machine learning techniques to trade options strategies and analyse the performance.

All the concepts covered in this email are taken from the Quantra course Machine Learning for Options Trading. You can preview the concepts taught in this classroom by clicking on the free preview button and going to Section 12 and Unit 1 and Section 12 and Unit 9 of the course.
Note: The links in this tutorial will be accessible only after logging into quantra.quantinsti.com.
Note that backtesting results do not guarantee future performance. The presented results are intended solely for educational purposes and should not be interpreted as investment advice.
In this post, we will cover the following topics:
- How does the decision tree predict a given output?
- Can you make the ML model predict an output only if its probability outcome is high?
- How much difference does adding a probability level make in the model’s performance?
If you are new to machine learning, check out our free course ‘Introduction to Machine Learning for Trading’.
How does the decision tree predict a given output?
In this classroom, you will try to predict if the S&P 500 index will move up or not in the next day. For this purpose, you will use two features based on technical indicator values. These are the ADX indicator values and the difference between the fast-moving average and the slow-moving average.
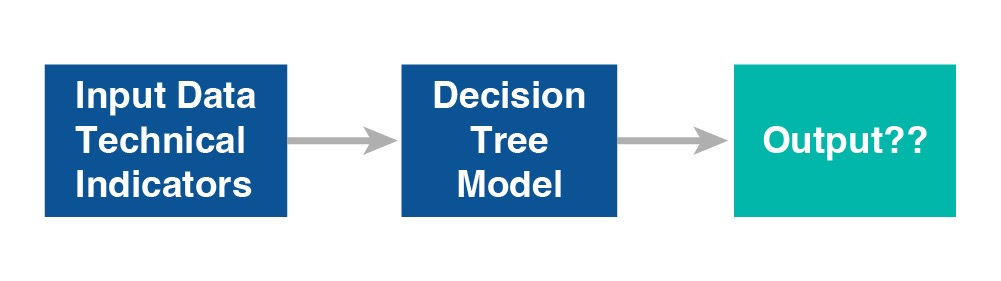
Figure: Process of Decision Tree Model
If the ADX value increases, in comparison to the previous day, you write it as 1. And if the fast-moving average minus the slow-moving average is positive, you write it as 1.
If not, then you will write it as 0.

Figure: Feature values
You will then pass these input features to the decision tree model.
During the training phase, there are 100 instances where both the input features are 1. The decision tree sees that when both features were 1, the S&P500 index value went up 52 times. And the S&P500 index went down 48 times.
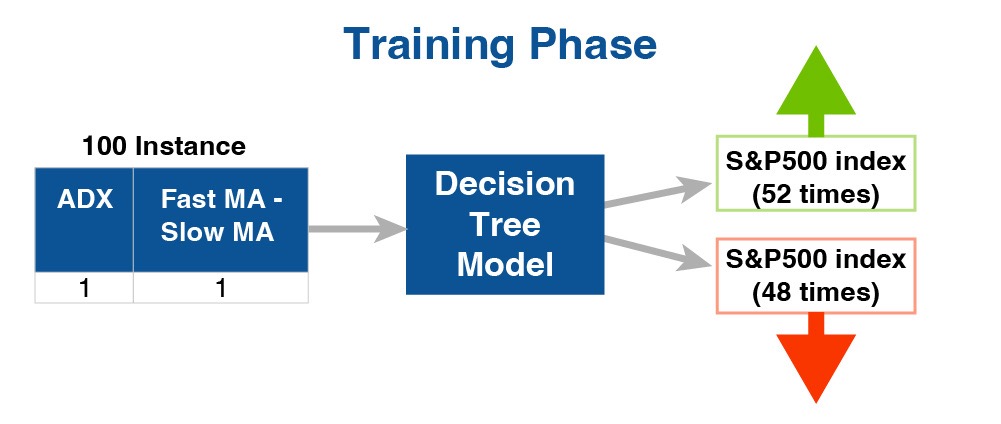
Figure: Training Phase
So, if both input features were 1, the probability that the index will go up is 0.52. The decision tree learns that if both features are 1, it is more likely that the index will go up, than down.
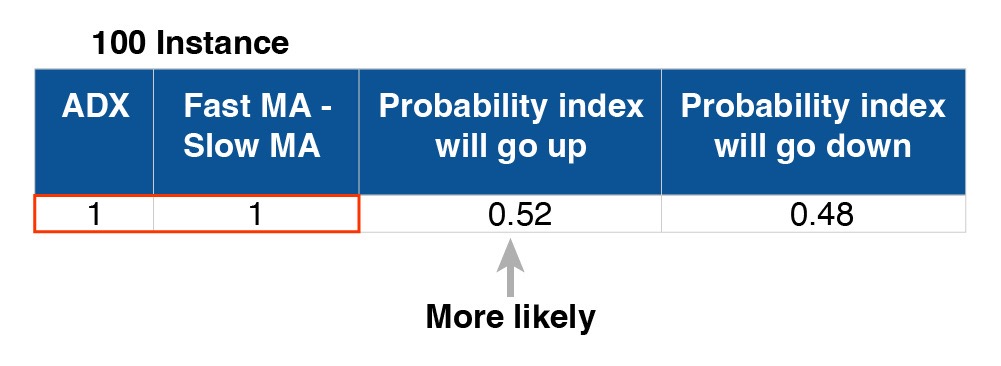
Figure: Prediction Based on Probability
This is why the decision tree will predict that the S&P500 index will go up if both features are 1 during testing.
If both the input features are 1, will you be confident that the index will always go up?
You are not sure that the index will always go up as the times it went up are only 8% (approximately) more than the times it went down.
Let’s see another instance where both the input features are 0. This happened 100 times. And the decision tree sees that out of 100 times, 30 times the index went up. And went down 70 times.
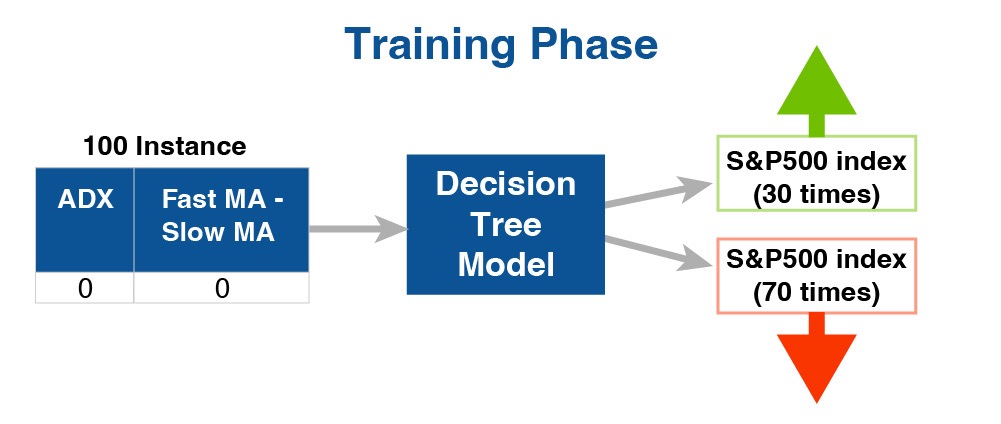
Figure: Training Phase Prediction
So the decision tree learns that if both input features are 0, there is a 0.7 probability that the index will go down.
Hence, the decision tree will predict that the S&P500 index will go down if both features are 0 during testing.
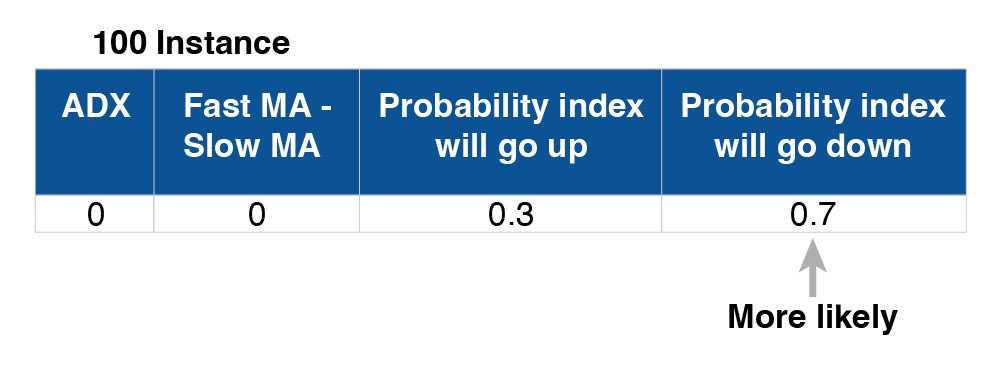
Figure: Likely Scenario
If both the input features are 0, will you be confident that the index will go down?
Yes. Because the number of times the index went down is 133% more than the times the index went up.
You can see that as the chances are higher for a particular outcome, your confidence also goes up in the prediction.
Can you make the ML model predict an output only if its probability outcome is high?
Yes. In Python, you can use the predict_proba() method of the sklearn library, to find out the probabilities of the predicted output. And further, you can set a probability level for the decision tree model.
For example, the decision tree model will predict the output of 1 only if the probability level is above 0.55.
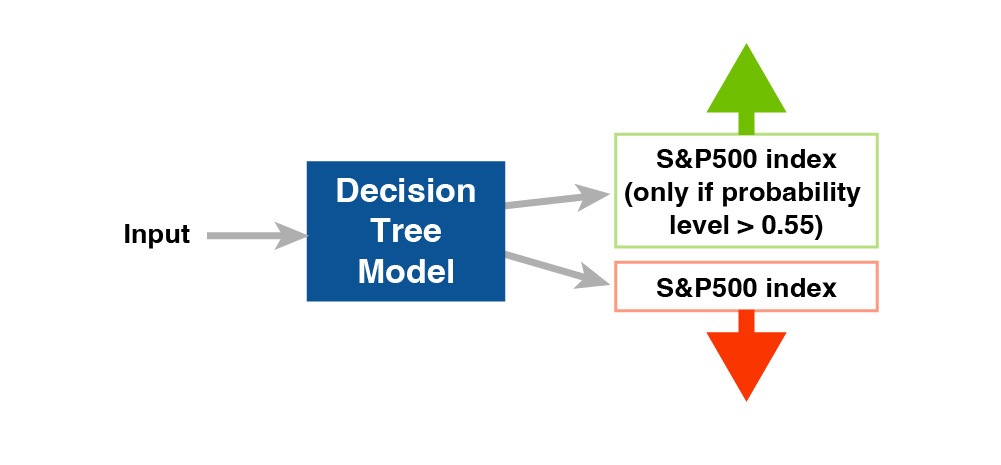
Figure: Setting Probability Level
How much difference does adding a probability level make in the model’s performance?
Before applying probability levels to the decision tree’s prediction, the strategy gave a cumulative return of 1.4.
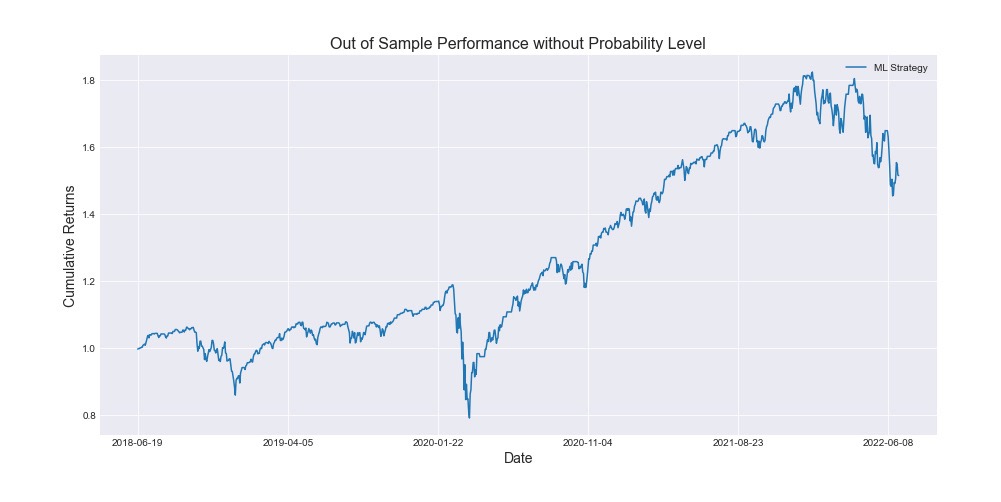
Figure: Out of Sample Performance without Probability Level
Note that backtesting results do not guarantee future performance. The presented results are intended solely for educational purposes and should not be interpreted as investment advice.
After applying the probability level of 0.55 to make a prediction, the strategy gave a cumulative return of 1.8.
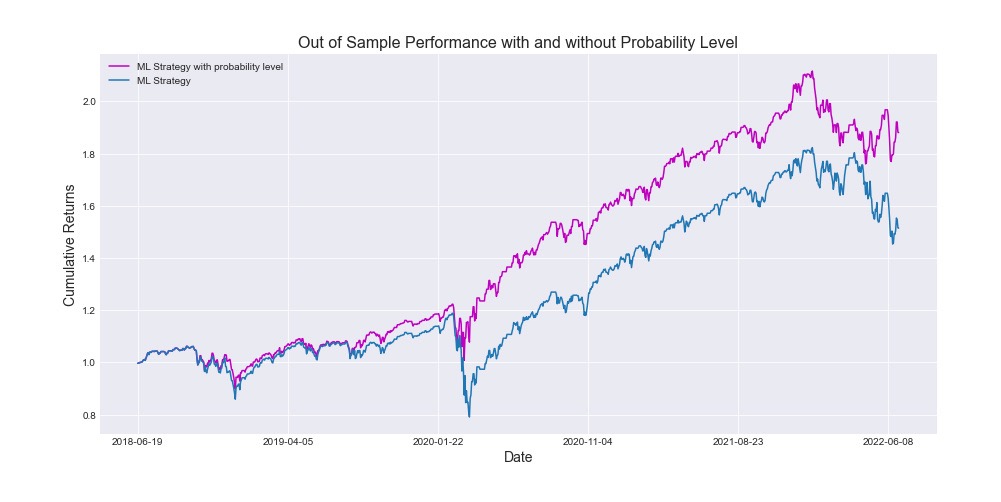
Figure: Out of Sample Performance With and Without Probability Level
Note that backtesting results do not guarantee future performance. The presented results are intended solely for educational purposes and should not be interpreted as investment advice.
You should realise that using probability levels might not increase the cumulative returns of your strategy in all cases.
If you want to compare the performance using the probability level thresholds using Python, you can refer to the notebook in section 12 and Unit 9 of the course ‘Machine Learning for Options Trading’.

What to do next?
Take a free preview of the course ‘Machine Learning for Options Trading’. In this course, you will learn how to apply cutting-edge machine learning techniques to trade options strategies and analyse the performance. From model selection to forecasting options prices, implied volatility and even option strategy to trade, you will gain hands-on experience with the tools and techniques used by industry professionals.

IMPORTANT DISCLAIMER: This email is for educational purposes only and is not a solicitation or recommendation to buy or sell any securities. Investing in financial markets involves risks and you should seek the advice of a licensed financial advisor before making any investment decisions. Your investment decisions are solely your responsibility. The information provided is based on publicly available data and our own analysis, and we do not guarantee its accuracy or completeness. By no means is this communication sent as the licensed equity analysts or financial advisors and it should not be construed as professional advice or a recommendation to buy or sell any securities or any other kind of asset.


