How to use LLMs for sentiment trading?
As a trader, staying ahead of market sentiment is essential for making informed decisions. Key events, such as earnings releases and interest rate announcements by central banks, can lead to significant price swings. Large Language Models (LLMs) offer a powerful tool to analyse these events much faster than humans can. In this post, you’ll learn how to harness the power of LLMs for sentiment trading.
The Quantra course ‘Trading Using LLM: Concepts and Strategienbbmmmnhs’ teaches how to utilise Large Language Models to build sentiment-driven trading strategies.

All the concepts covered in this post are taken from the Quantra course Trading Using LLM: Concepts and Strategies. You can preview the concepts taught in this post by clicking on the free preview button and going to Section 16 and Unit 6 of the course.
Note: The links in this tutorial will be accessible only after logging into quantra.quantinsti.com.
In this post, we will cover the following topics:
- Why use LLMs for sentiment analysis?
- Sentiment analysis trading process
- Sentiment analysis of FOMC transcripts
- Trading strategy based on sentiment analysis
- Performance analysis of the strategy
The sentiment analysis and implementation of the strategy is done using Python, therefore, if you’re new to Python then you’ll find the course on Python for Trading! quite helpful.
Application of LLMs for sentiment analysis
In financial markets, sentiment from key events like FOMC (Federal Open Market Committee) meetings can significantly impact trading decisions. FinBERT, an LLM fine-tuned for financial language, excels at extracting subtle emotional cues from reports, translating them into sentiment scores—positive, negative, or neutral. This allows traders to interpret market sentiment and incorporate it into trading strategies, giving them a valuable edge in responding to shifts in sentiment.
Sentiment analysis trading process
The sentiment analysis trading process involves a series of steps that transform raw financial text data into actionable trading insights. Here’s a streamlined approach that traders can follow:
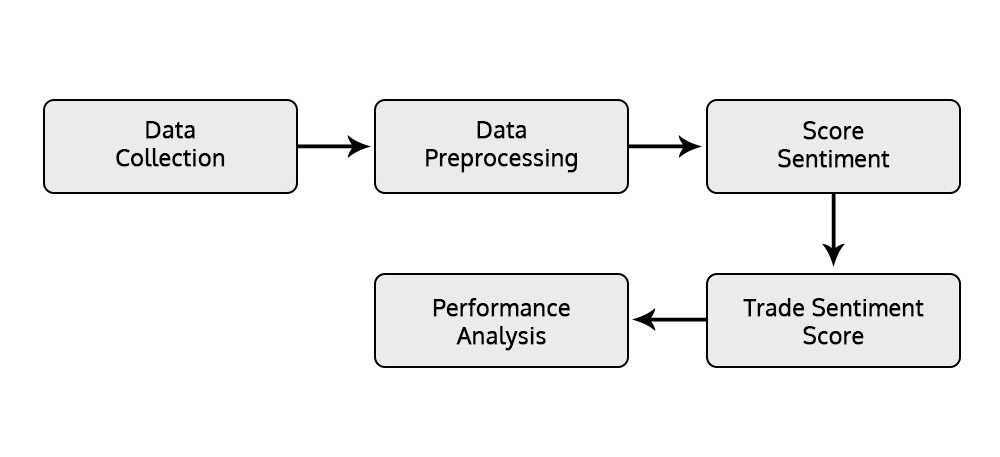
Figure: Sentiment Analysis Trading Process
1. Data Collection: Gather raw data from sources like FOMC transcripts or earnings calls. This can be in text, audio, or video form from official websites.
2. Preprocessing: Clean the data by transcribing, removing irrelevant content, and segmenting it to ensure it's ready for analysis.
3. Sentiment Scoring: Use models like FinBERT to assign sentiment scores (positive, negative, or neutral) to the processed data.
4. Trading Strategy: Apply these sentiment scores to your strategy by setting thresholds to trigger trades based on market sentiment shifts during key events.
5. Performance Analysis: Evaluate both strategy and trade-level performance to study profitability.
This process allows traders to effectively incorporate sentiment analysis into their trading strategies for better decision-making.
Let’s understand how this sentiment analysis trading process is applied to analyse the FOMC transcripts and trade as per the sentiment.
Sentiment analysis of FOMC transcripts
FOMC transcripts provide key insights into monetary policy, economic assessments, and future outlooks, shaping market sentiment and trading strategies.
The analysis begins with data collection from the Federal Reserve’s official website. The transcripts are then preprocessed to remove irrelevant sections and focus on content that reflects market sentiment. FinBERT is used to assign sentiment scores, helping traders gauge whether the sentiment is positive or negative.
The following table represents sentiment scores of FOMC transcripts at a minute frequency. Each row corresponds to a specific minute during the transcript. For example, the meeting text from 19:30 to 19:31 is stored in the ‘text’ column and the sentiment score of this text, which is 0.395, is stored in the column ‘sentiment_score’.
This analysis helps quantify how the sentiment changes over time during the FOMC meeting.
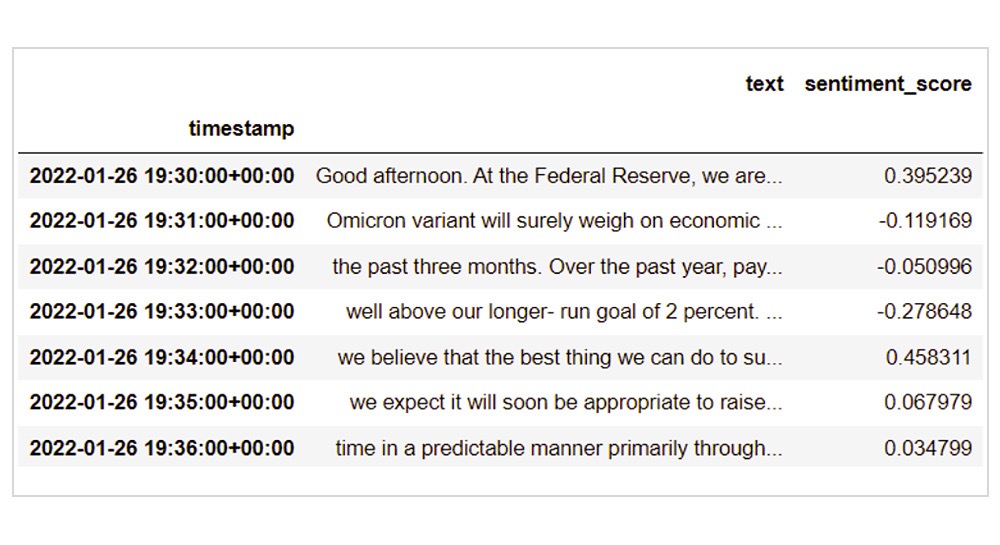
Figure: Table with FOMC transcripts text at minute frequency and its sentiment score
Trading strategy based on sentiment analysis
The strategy revolves around analysing rolling sentiment scores and establishing specific thresholds for trading decisions.
Generating Trade Signals: The first step involves calculating the rolling mean of sentiment scores, which reflects the average sentiment over the minute-wide data collected throughout the FED meeting. By averaging these scores, traders can gauge the prevailing market sentiment and make informed trading decisions based on the trends observed.
You can find the rolling sentiment score in the ‘rolling_sentiment_score’ column in the following table. It should be noted that the sentiment score values are rounded off to two decimals.
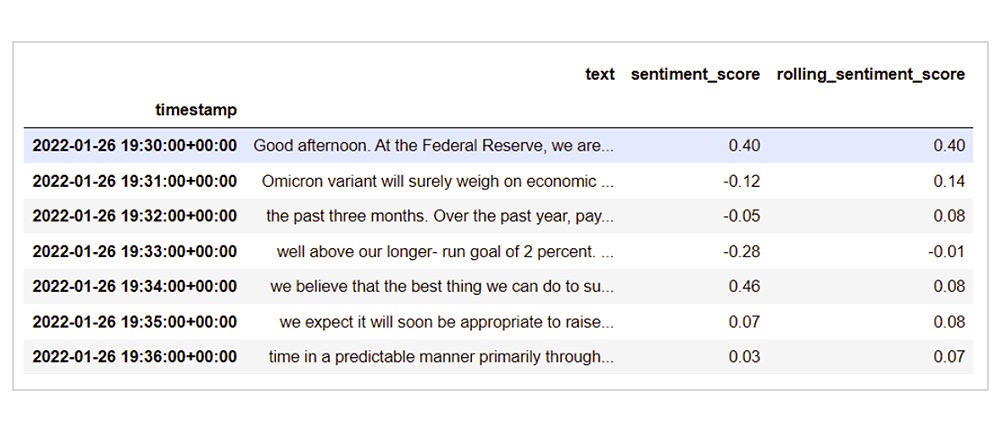
Figure: Table with FOMC transcripts text with their sentiment score and rolling sentiment score
For example, the rolling sentiment score at 19:30:00 (0.14) is an average of sentiment scores so far, which is an average of 0.4 and -0.12.
Similarly, the rolling sentiment score at 19:32:00 (0.08) is an average of 3 sentiment scores 0.4, -0.12, -0.05.
Setting Thresholds: In this strategy, a sentiment score greater than 0 indicates positive sentiment, while a score below 0 suggests negative sentiment. In this example, a threshold of 0.1 will be used.
Entry and Exit Rules:
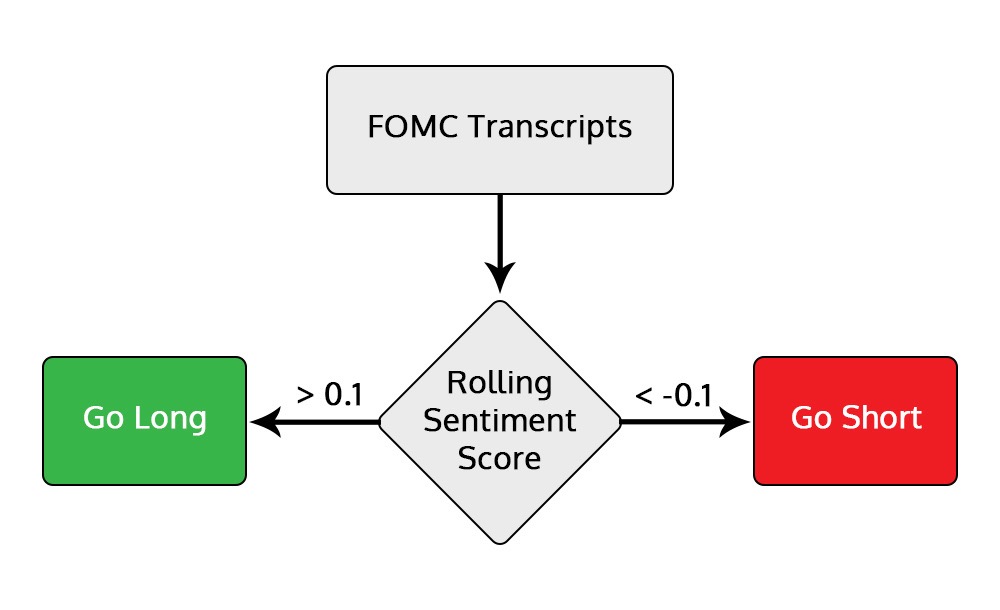
Figure: Entry rules of long and short position
Long Position: Enter when the rolling sentiment score is greater than 0.1. Exit the position either when the rolling sentiment falls below -0.1 or at the last minute of the FOMC meeting.
Short Position: Open a short position when the rolling sentiment score is less than -0.1. Exit when the rolling sentiment exceeds 0.1 or at the last minute of the FOMC meeting.
Performance Analysis of Strategy
Backtesting this strategy from January 2022 to July 2024 has yielded positive cumulative returns.
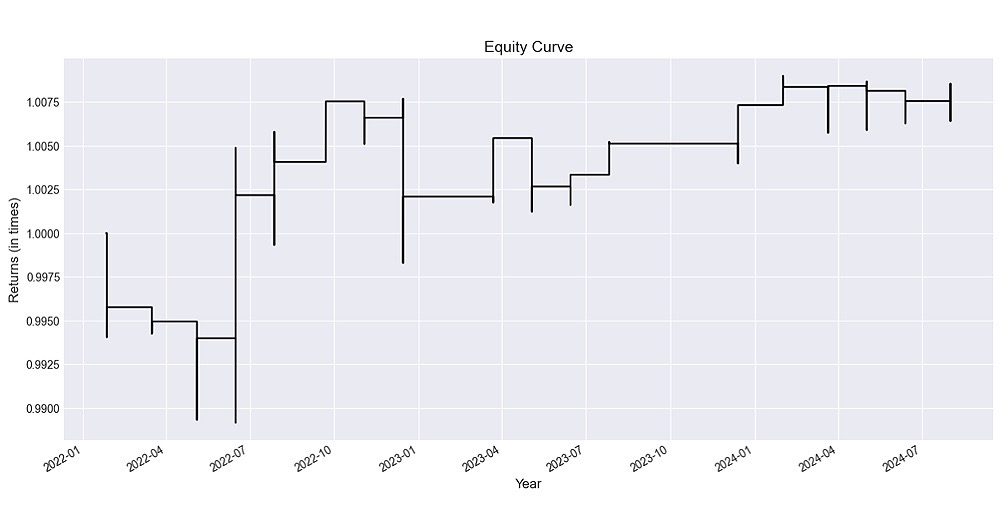
Figure: Cumulative returns of the trading strategy
While the overall returns are not exceptionally high, this is because positions are opened exclusively during FED meetings. As a result, the strategy doesn't tie up capital on non-FED meeting days, allowing that capital to be allocated to other trading strategies in the meantime.
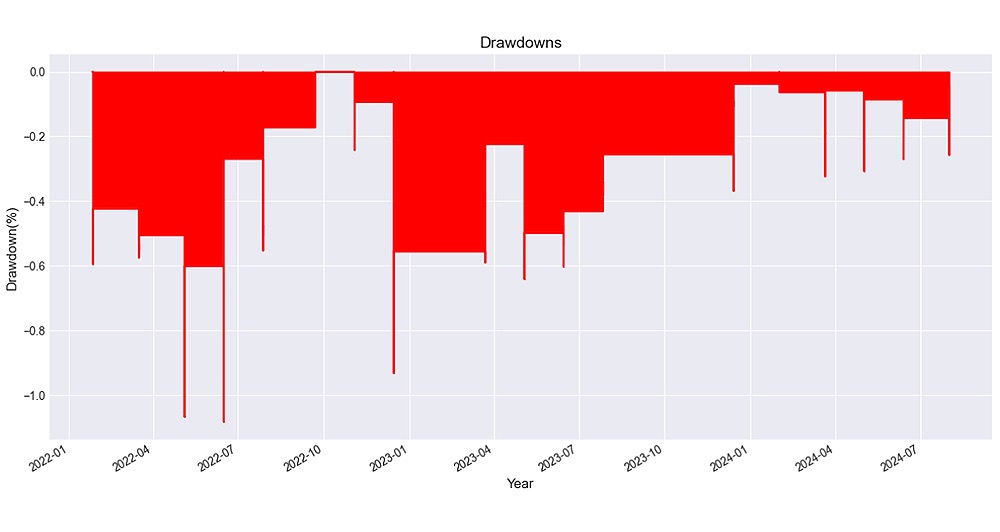
Figure: Drawdowns of the trading strategy
The maximum drawdown of the strategy, which measures the largest peak-to-trough decline in portfolio value, is just 1.08%. This low drawdown indicates that the strategy has experienced minimal losses during its worst-performing period, reflecting stability.
To generate trading signals based on the threshold of sentiment score, backtest the trading strategy and analyse its performance using Python, you can refer to the notebook in the section 16 and Unit 6 of the course ‘Trading Using LLM: Concepts and Strategies’.

What to do next?
Take a free preview of the course ‘Trading Using LLM: Concepts and Strategies’. Learn to utilise Large Language Models (LLMs) to build sentiment-driven trading strategies. Also, learn to extract sentiment scores from event transcripts like FED meetings or earnings calls, and develop different strategies around it. Analyse your strategy's performance rigorously, leveraging LLM capabilities for informed trading decisions.

IMPORTANT DISCLAIMER: This post is for educational purposes only and is not a solicitation or recommendation to buy or sell any securities. Investing in financial markets involves risks and you should seek the advice of a licensed financial advisor before making any investment decisions. Your investment decisions are solely your responsibility. The information provided is based on publicly available data and our own analysis, and we do not guarantee its accuracy or completeness. By no means is this communication sent as the licensed equity analysts or financial advisors and it should not be construed as professional advice or a recommendation to buy or sell any securities or any other kind of asset.


