How to Trade Volatility using Bollinger Bands?
Volatility is the lifeblood of trading, and mastering it can be the key to unlocking consistent performance. For traders, Bollinger Bands offer a powerful way to navigate market swings by capturing volatility in real-time. These dynamic bands help traders identify potential entry and exit points by highlighting when a market is overbought or oversold, providing valuable insights into price fluctuations.
In this post, we’ll dive into how you can use Bollinger Bands to trade volatility effectively, giving you the tools to better time your trades and manage market risks with confidence.
All the concepts covered in this post are taken from the Quantra course Volatility Trading Strategies for Beginners. You can preview the concepts taught in this classroom by clicking on the free preview button and going to Section 10 Unit 12 of the course.
Note: The links in this tutorial will be accessible only after logging into quantra.quantinsti.com


In this post, we will cover the following topics:
- What are Bollinger bands?
- Trading volatility using Bollinger bands
- Trading Strategy Based on Oversold Condition
What are Bollinger bands?
Bollinger Bands are a popular technical analysis tool used by traders to assess market volatility and identify potential price reversals. Developed by John Bollinger, this indicator consists of three lines: a middle band, which is a simple moving average (SMA), and two outer bands that are typically set two standard deviations away from the SMA. The outer bands expand when volatility increases and contract when volatility decreases, creating a visual representation of market momentum.
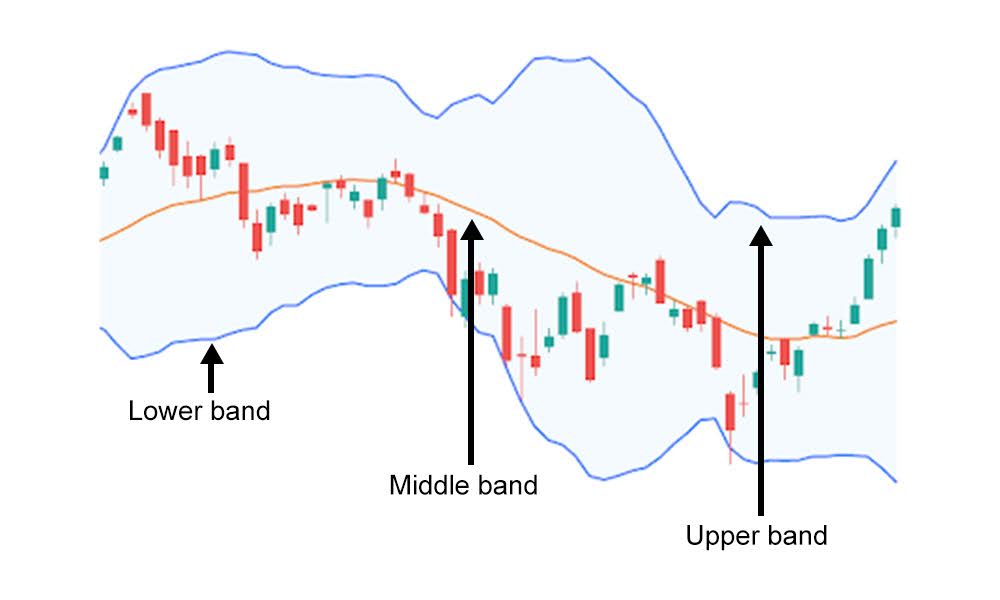
Figure: Illustration of Bollinger Bands
Traders use Bollinger Bands to spot overbought or oversold conditions, as prices nearing or crossing the outer bands often signal potential reversals or breakout opportunities.
Trading volatility using Bollinger bands
Trading volatility using Bollinger Bands revolves around the concept of market overreactions. The bands themselves expand and contract based on market volatility, offering a visual representation of price movement.
When the price moves outside of the bands, it indicates a period of increased volatility. Prices closing above the upper band signal overbought conditions, meaning the market may have moved too far upward too quickly. Conversely, when the price dips below the lower band, it suggests oversold conditions, where the market may have overreacted to the downside.
The idea behind trading volatility with Bollinger Bands is that extreme price movements outside the bands often lead to reversals. When the bands widen, volatility increases, and when the bands tighten, the market is calmer. By monitoring these conditions, traders can identify potential turning points in the market, making Bollinger Bands an effective tool for managing volatility in various asset classes like stocks, forex, and cryptocurrencies.
Trading Strategy Based on Oversold Condition
To trade an oversold condition using Bollinger Bands, the strategy involves taking a long position when the price closes below the lower band, indicating that the market is in an oversold state. Here's how the strategy works:
Entry Rules:
- Enter a long position when the price closes below the lower Bollinger Band, signifying an oversold condition.
Exit Rules:
- Exit the trade when the price reaches the middle Bollinger Band (the 20-period simple moving average), which often indicates that the price has reverted to its mean.
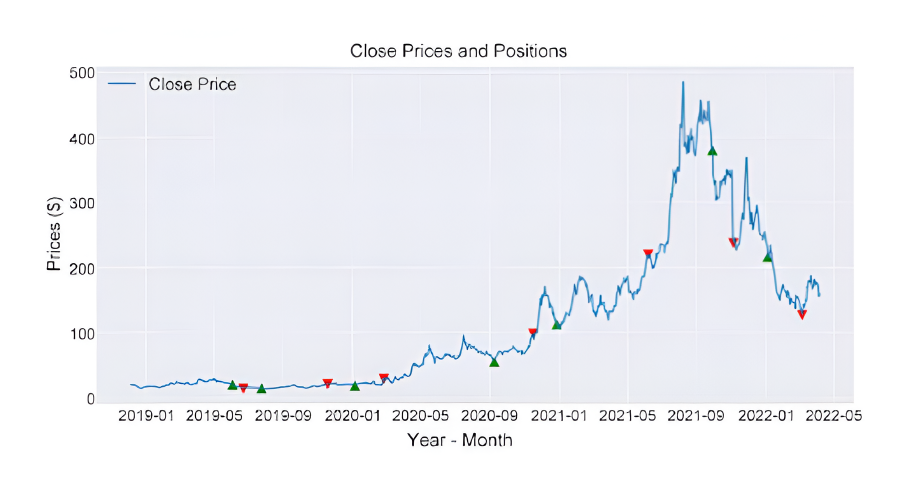
Figure: Positions Taken Based on Bollinger Band Signals
By following this strategy, traders can capitalise on price reversals when the market overreacts to the downside. It's important to use a stop-loss, such as placing it below a recent swing low, to manage risk in case the price continues to fall after entry.
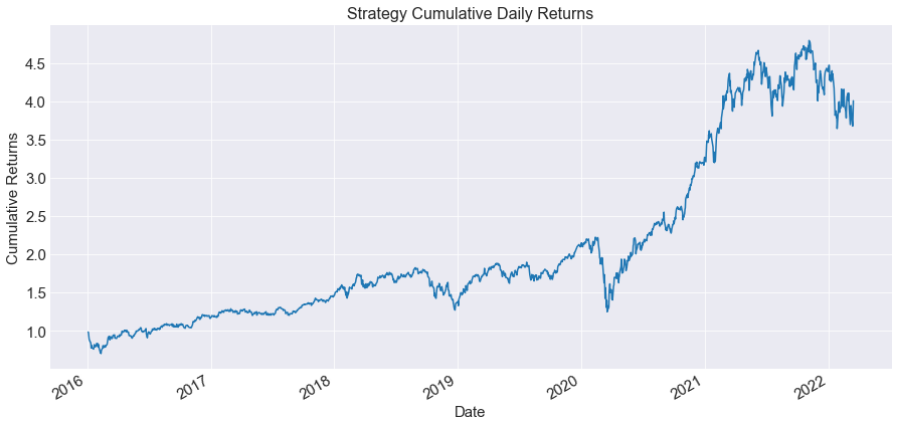
Figure: Strategy Cumulative Returns
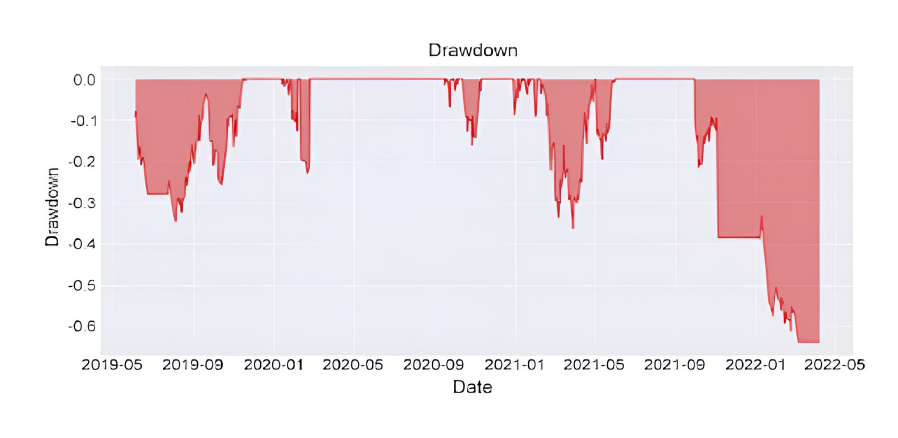
Figure: Strategy Drawdowns
The strategy was able to get a positive CAGR of 34%, but the Sharpe ratio is less than one, at 0.8, and the maximum drawdown happens to be big at the end of the sample. This kind of strategy works well if the stock is mean reverting. So for better performance, take positions when the middle band is flat, instead of trending.
The strategy discussed above has been covered in detail along with the Python code in this unit of the Volatility Trading Strategies for Beginners course. You need to take a Free Preview of the course by clicking on the green-coloured Free Preview button on the right corner of the screen next to the FAQs tab and go to Section 10 and Unit 12 of the course.

What to do next?
- Go to this course
- Click on Free preview
- Go through 10-15% of course content
- Drop us your comments and queries on the community
IMPORTANT DISCLAIMER: This post is for educational purposes only and is not a solicitation or recommendation to buy or sell any securities. Investing in financial markets involves risks and you should seek the advice of a licensed financial advisor before making any investment decisions. Your investment decisions are solely your responsibility. The information provided is based on publicly available data and our own analysis, and we do not guarantee its accuracy or completeness. By no means is this communication sent as the licensed equity analysts or financial advisors and it should not be construed as professional advice or a recommendation to buy or sell any securities or any other kind of asset.


