Trade Momentum using a Dynamic Threshold
While trading momentum it’s all great until the prices are trending in the right direction, but what happens when it doesn’t? What if you go long on a stock based on positive returns in the past but instead of continuing in an upward trend, the trend reverses. This is called a false signal. Market volatility can result in frequent price fluctuations which eventually can lead to false signals. How should we trade in such scenarios? Well, you’re about to find out!
All the concepts covered in this email are taken from the Quantra course Advanced Momentum Trading: Machine Learning Strategies.
Note: The links in this tutorial will be accessible only after logging into quantra.quantinsti.com
Note that backtesting results do not guarantee future performance. The presented strategy results are intended solely for educational purposes and should not be interpreted as investment advice.

The traditional time-series momentum strategy uses a static threshold. For example, if the past returns are above 0 we go long and when they’re below 0 we go short. The static nature of the threshold may fail to capture volatility, not just that, this threshold may differ from one asset to another due to asset-specific volatility and market dynamics. For example, forex should have a low threshold value due to lower volatility, on the other hand, cryptocurrency should have a higher threshold value due to higher volatility.
So instead of having a static threshold, what if we have a dynamic threshold? Like a custom threshold tailored for changing market volatility and different types of assets! In this classroom, you will learn how to create a dynamic threshold time-series momentum strategy.
In this Quantra Classroom, we will cover the following topics:
- What is a dynamic threshold and why do we need it?
- How to set the threshold?
- Create a dynamic-threshold based strategy
- Backtesting the strategy
This strategy has been backtested using Python. If you are new to Python, you can take a look at Quantra’s free course on Python for Trading: Basic.
What is a dynamic threshold and why do we need it?
A static threshold works great in a trending market but, is it viable for markets with high volatility? Does it capture volatility and the changing market conditions? Well, the static nature of the threshold makes it difficult to adapt. Not just that, a single threshold value across different asset classes may not be ideal. Each asset class should have an asset-specific threshold. In the image below, you can see the difference in volatility between two different asset classes i.e. forex and cryptocurrency:
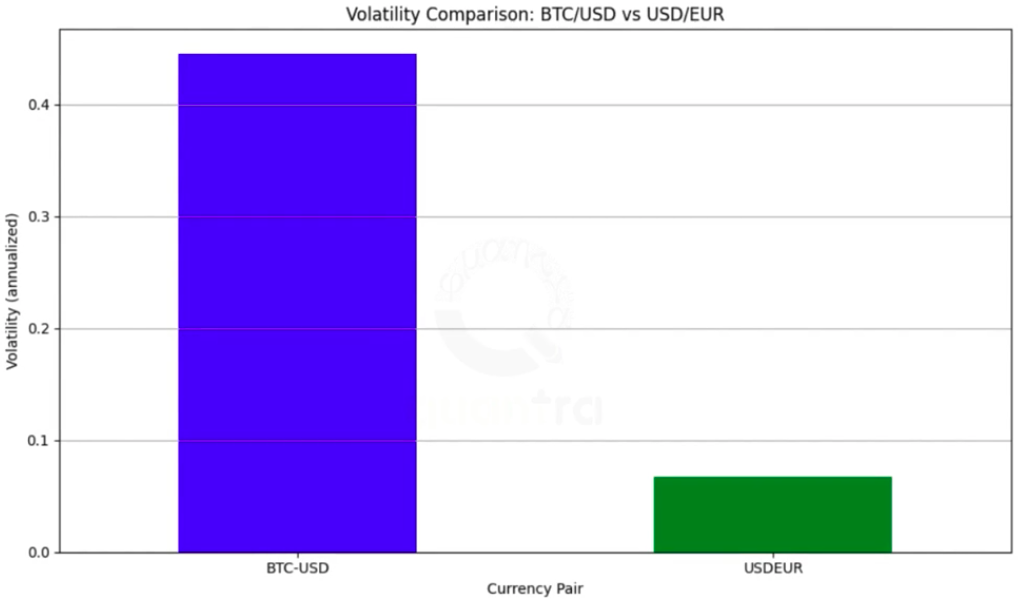
As you can see, the annualised volatility is high in BTC-USD, whereas in USD-EUR it’s quite low. In this case, for example, if you set an annualised volatility based threshold of 0.2 it would be too high for USD-EUR and too low for BTC-USD.
To overcome this issue we can set a dynamic threshold. A dynamic threshold can be tied to the standard deviation of an asset, and this would result in auto-adjustments of the threshold on the basis of standard deviation of a particular asset. By setting a dynamic threshold, we can adapt to changing market conditions and provide flexibility across different asset classes.
How to set the dynamic threshold?
If we want to capture volatility, what should we consider for setting the dynamic threshold? A metric that measures volatility i.e., standard deviation. Therefore, one of the ways to set a dynamic threshold is by using standard deviation to decide the threshold. This will serve as a measure of market volatility. If the threshold is tied to the changing standard deviation of an asset, the threshold too will automatically keep adjusting to the current market conditions.
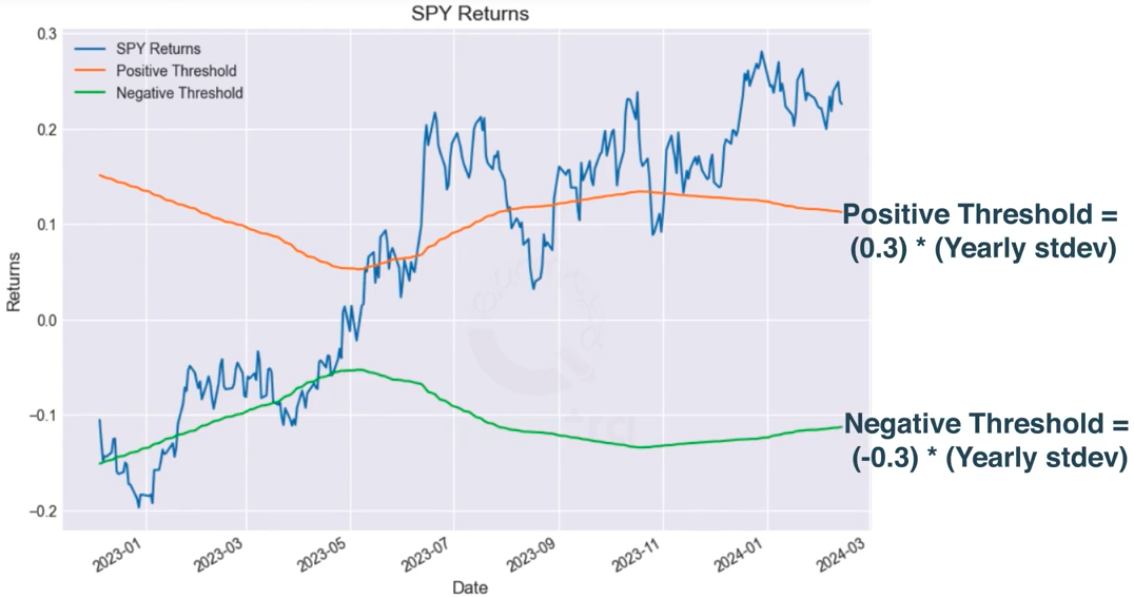
We can take a value and multiply it by the standard deviation of the asset to get the dynamic threshold. The value could be 0.1, 0.2, 0.3, 0.4, etc. Let’s say that we set the value as 0.3, in this case:
Positive threshold = 0.3 * Yearly Standard Deviation
Negative threshold = -0.3 * Yearly Standard Deviation
Now that you know how to calculate the threshold, let’s find out how to create a time-series momentum strategy based on this threshold.
Create a dynamic-threshold based strategy
Well, the strategy rules are very much similar to the traditional time-series momentum strategy. In time-series momentum, we check if the past returns are positive or negative. If they are positive, we assume that the trend will persist and go long. If they are negative, we go short.
The only difference in the dynamic threshold strategy is that instead of keep the threshold of 0 constant to ascertain positive and negative, we will keep adjusting it on the basis of volatility.
Let’s continue with the example taken above to understand the strategy rules. Let’s say the thresholds are as follows:
Positive threshold = 0.3 * Yearly Standard Deviation
Negative threshold = -0.3 * Yearly Standard Deviation
Therefore, to trade a dynamic-threshold based strategy, we will:
Go long when the past returns are greater than the positive threshold
Go short when the past returns are lesser than the negative threshold
No position when the returns are between the positive and negative threshold.
The value of 0.3 has been taken for the purpose of illustration and you can change this to any other value based on your preferences.
You can learn more about the dynamic threshold-based strategy by watching the video in the course Advanced Momentum Trading: Machine Learning Strategies.

Backtesting the strategy
To backtest this strategy, you can calculate the standard deviation of your favourite asset, create a dynamic threshold, and generate momentum trading signals - all with the help of Python.
You can also backtest this strategy to check how it has performed on past data. We backtested this strategy on SPY not just with a single threshold but with multiple variations of the dynamic threshold, all with the help of a single function.
To check out the results of the strategy using multiple thresholds and to get Python code for creating and backtesting this strategy you can head to this unit of the Advanced Momentum Trading: Machine Learning Strategies course. You can also use this code to implement this strategy on your favourite asset, but keep in mind, the backtest results would vary for different assets.
To get the code, all you need to do is take a Free Preview of the course by clicking on the green-coloured Free Preview button on the right corner of the screen next to the FAQs tab and go to Section 9 and Unit 6 of the course.

What to do next?
- Go to this course
- Click on
- Go through 10-15% of course content
- Drop us your comments and queries on the community

IMPORTANT DISCLAIMER: This email is for educational purposes only and is not a solicitation or recommendation to buy or sell any securities. Investing in financial markets involves risks and you should seek the advice of a licensed financial advisor before making any investment decisions. Your investment decisions are solely your responsibility. The information provided is based on publicly available data and our own analysis, and we do not guarantee its accuracy or completeness. By no means is this communication sent as the licensed equity analysts or financial advisors and it should not be construed as professional advice or a recommendation to buy or sell any securities or any other kind of asset.


