Price prediction using Machine Learning Regression
In the ever-changing financial markets, traders analyse data to predict stock prices and make profitable trades. Machine learning offers the potential to augment their intuition by uncovering hidden patterns in vast historical data. In this classroom, we present a study on predicting Gold (GLD) ETF prices using machine learning regression techniques and assessing the strategy returns based on the predictions.
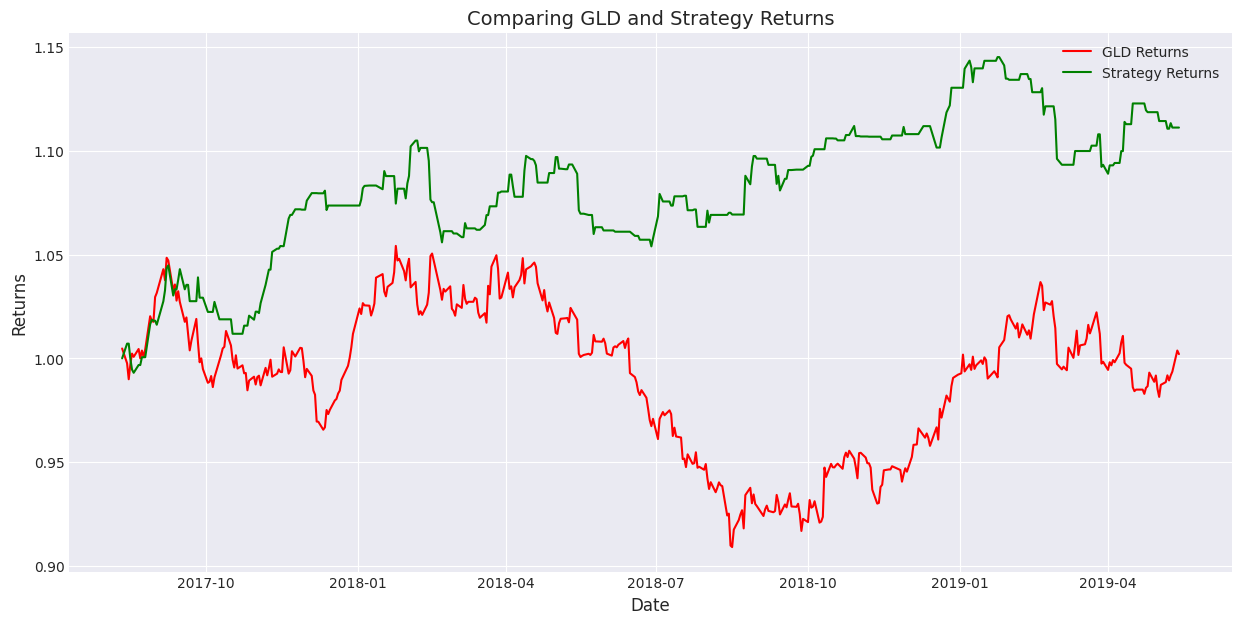
The results of applying a machine learning regression-based price prediction strategy on Gold (GLD) ETF from April 2013 to May 2019 are shown below. The Python code for the strategy is available here. It is important to note that backtesting results do not guarantee future performance. The presented strategy results are intended solely for educational purposes and should not be interpreted as investment advice. A comprehensive evaluation of the strategy across multiple parameters is necessary to assess its effectiveness.
All the concepts covered in this tutorial are taken from this Quantra course on Trading with Machine Learning: Regression. You can take a Free Preview of the course and learn all these concepts in detail.
Note: The links in this post will be accessible only after logging into quantra.quantinsti.com

Machine Learning Regression For Price Prediction:
Regression is a statistical technique to model relationships between variables. Machine learning regression uses algorithms for predictive modelling without explicitly defining relationships between variables.
Machine learning regression plays a vital role in the domain of price prediction. As a supervised learning technique, it enables traders and investors to forecast future prices based on historical market data. By analysing relevant features and financial indicators, regression models can identify patterns and trends in the contract’s historical behaviour.
The process involves training the algorithm on past price movements and target variables (actual prices) to create a predictive model. Once trained, the model can be used to generate forecasts for future prices, helping traders make informed decisions on when to buy, sell, or hold a particular asset.
In today’s classroom, let’s create a trading strategy based on the prices predicted by the machine learning regression model and analyse the performance.
The following are the three parts involved in this study.
Part-1: Data Preparation
Part-2: Data Preprocessing and Prediction
Part-3: Strategy Analytics
Part-1: Data Preparation
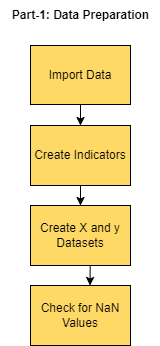
We will start the study by importing the Gold (GLD) ETF data from April 2013 to May 2019. Based on this data, we will create the indicators which can be used as input parameters to the machine learning regression model.
The indicators comprise:
- 3-day, 15-day and 60-day moving averages for GLD close prices.
- The indicator representing the market change compared to the previous open. (Today's open – Previous open)
- The indicator representing the overnight changes in the prices. (Previous close – Today's open)
- The indicator representing the correlation. (Correlation between close price and 3-days moving average)
The indicators above along with the open prices are used as the input parameters (features) to the machine learning regression model.
We create the machine learning regression model to predict the upward and downward deviations of price the next trading day. So, the output parameters include:
- Upward deviation (High – Open)
- Downward deviation (Open – Low)
Once the input and output parameters are created, check and drop the NaN values.
So, by the end of part-1, you are left with input and output parameters for the machine learning regression model.
Part-2: Data Preprocessing and Prediction
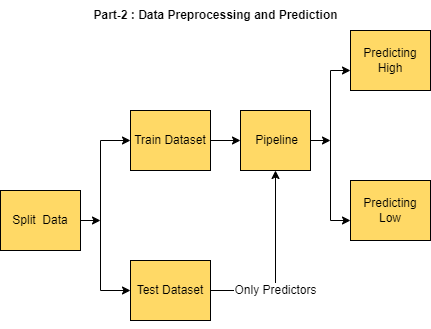
- Once the data is prepared, the data is preprocessed and used for prediction.
- The prepared data is split into train and test datasets in a ratio of 70:30.
- Following this, create a machine learning pipeline for scaling the data and fitting the data into the linear regression model.
- Find the suitable parameters for the linear regression model by using the grid search cross-validation.
- Fit the model using the training set and predict the upward and downward deviation of prices using the test dataset.
A predicted high is calculated by adding the predicted upward deviation to the open price. Similarly, A predicted low is calculated by subtracting the predicted downward deviation from the open price.
Part-3: Strategy Analytics
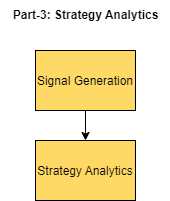
After the prediction of high and low, create a trading strategy based on the predicted prices.
- The strategy then determines whether to go short or long based on a comparison between the actual high and low of the next trading day and the predicted high and low.
- If the actual high is greater than the predicted high and the actual low is higher than the predicted low, a short position is taken.
- Conversely, if the actual high is lower than the predicted high and the actual low is lower than the predicted low, a long position is taken.
Here is the comparison of the performance of the strategy based on the above trading rules and the GLD ETF in the same trading period.
It is important to note that backtesting results do not guarantee future performance. The presented strategy results are intended solely for educational purposes and should not be interpreted as investment advice. A comprehensive evaluation of the strategy across multiple parameters is necessary to assess its effectiveness.
Conclusion
In conclusion, machine learning regression enhances price prediction and trading strategies. Continuous learning and adaptability are vital for success in dynamic financial markets. Stay informed and embrace innovation for confident and efficient trading.
To learn the concepts learned in today’s classroom in a step-by-step fashion, head to our course on Trading with Machine Learning: Regression.
What to do next?
- Go to this course
- Click on
- Go through 10-15% of the course content

Drop us your comments, and queries on the community
IMPORTANT DISCLAIMER: This post is for educational purposes only and is not a solicitation or recommendation to buy or sell any securities. Investing in financial markets involves risks and you should seek the advice of a licensed financial advisor before making any investment decisions. Your investment decisions are solely your responsibility. The information provided is based on publicly available data and our own analysis, and we do not guarantee its accuracy or completeness. By no means is this communication sent as the licensed equity analysts or financial advisors and it should not be construed as professional advice or a recommendation to buy or sell any securities or any other kind of asset.


