Multivariate Linear Regression
How can Two Stocks’ Prices Predict Another Stock's Price?
The simple answer is "Multivariate Linear Regression". Let us dive deeper into this useful concept and find out all about it.
You must have always heard about linear regression being used to predict a stock’s price. Generally, a stock price is forecasted from another stock price.
For example, you can forecast the prices of J.P. Morgan (JPM) from the prices of Citigroup (C). But can you predict the prices of J.P. Morgan from Citigroup as well as Bank of America (BAC)? And does it improve the forecasting accuracy? Let's find out.
All the concepts covered in this tutorial are taken from Section 9 Unit 1 of this Quantra course on Financial Time Series Analysis for Trading. You can take a Free Preview of the course to browse through other course topics.
Note: The links in this email will be accessible only after logging into quantra.quantinsti.com and enrolling in the Free Preview of the course.
What is multivariate linear regression?
Multivariate linear regression is an extension of simple linear regression, where you have only one independent variable. In multivariate linear regression, you aim to determine the linear relationship between several independent variables and the dependent variable.
Confused? Don’t worry, let’s dive in with an example.
Now, you know that Citigroup is in the same sector as J.P. Morgan.

Can there be a correlation between the two?
Let’s plot both the stock prices together for the same day and see if we can find a correlation. This plot, as you guessed it, is the scatter plot.
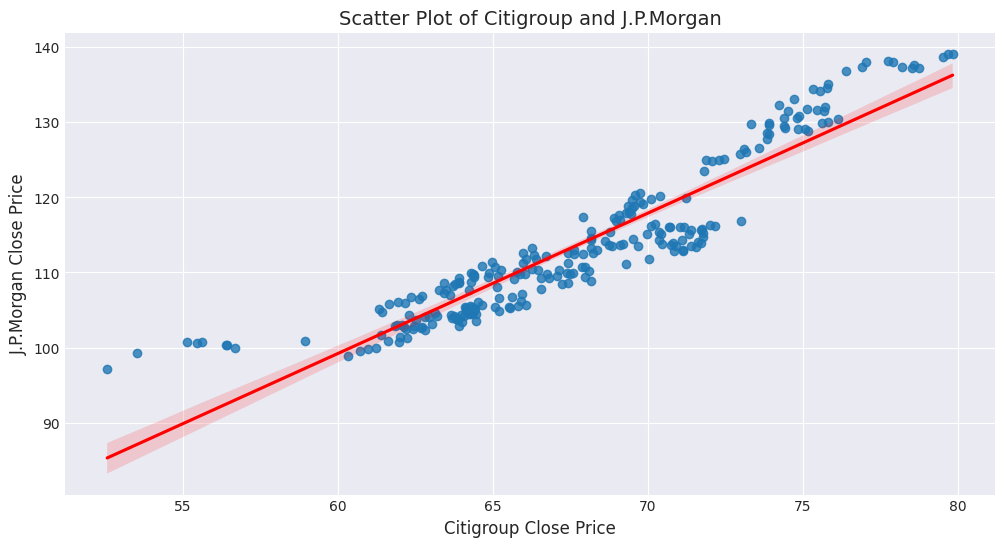
The scatter plot shows a fair degree of correlation.
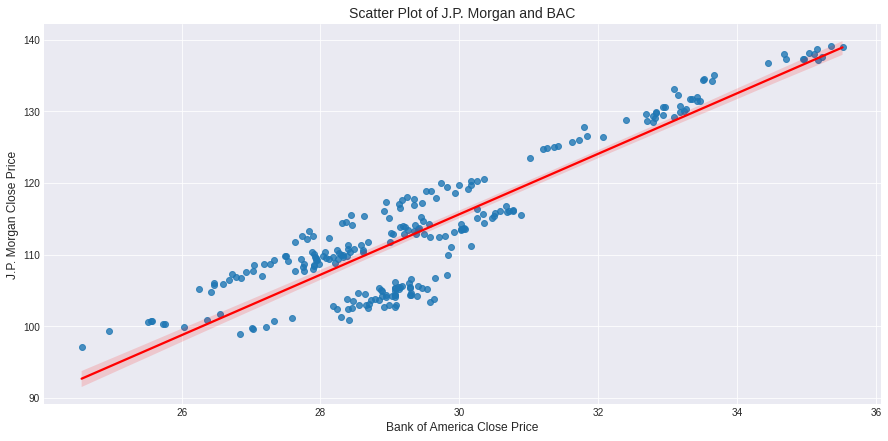
Similarly, there is a fair degree of correlation between BAC and JPM.
Instead of creating two linear regression models, can you combine Citigroup’s price and Bank of America’s price into one model to predict J.P. Morgan’s price?
Yes.
This is called multivariate linear regression. It is called multivariate as we use more than one variable or multiple variables to predict the dependent variable.
For a single variate linear regression, the equation is shown below:
JPM = m1 * BAC + intecept
This equation can be extended to two variables by adding Citigroup to it.
JPM = m1 * BAC + m2 * C + intecept
Can you think of how the equation will look like if we add Wells Fargo to this equation?
JPM = m1 * BAC + m2 * C + m3 * WFC + intercept
After applying linear regression, the equation for the multivariate linear regression model is as shown below:
JPM = 1.61 * BAC + 1.2 * C - 16.53.
You have formulated the equation. How do you know this is effective?
The solution is goodness of fit. The goodness of fit test compares actual data to expected or predicted data. In simple terms, you are checking how good the predicted result is in comparison to the actual observed data.
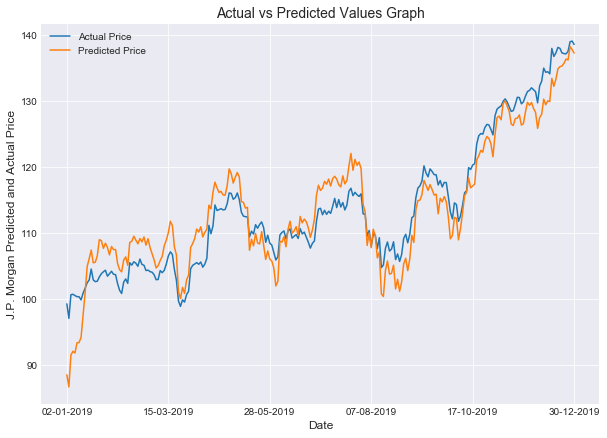
The goodness of fit for Citigroup was 81%. However, using both BAC and Citigroup in the model, the R-squared increases from 81% to 88%. This indicates that the model is better able to predict the prices of JPM by using both C and BAC prices.
The graph of the actual and predicted prices is shown below.
What to do next?
- Get the code from Section 9 Unit 6 of this course
- Forecast the prices of Amazon Stock using the prices of Meta and Apple
If you need any help, drop us your queries on the community.


