Mean Reversion in Capital Markets
We will delve into the intricacies of mean reversion trading here, unravelling its principle and a trading strategy based on it. Whether you're a curious observer or an aspiring trader, join us as we explore how the ebb and flow of asset prices around their average values can be harnessed to create trading strategies in the exciting world of financial markets.
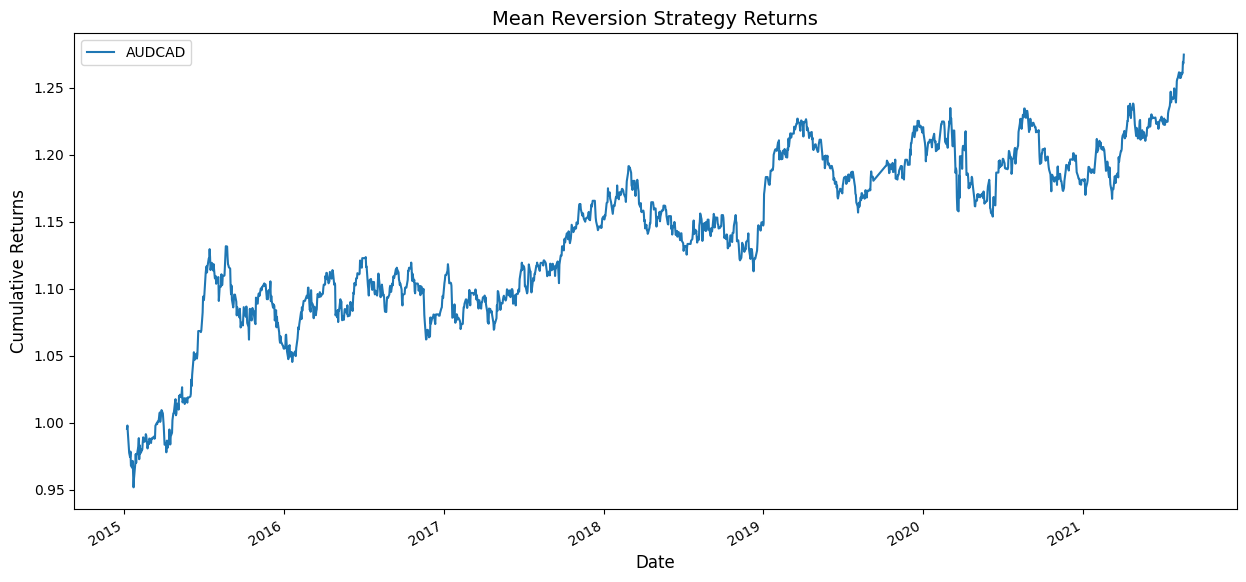
The results of applying a mean reversion trading strategy on AUDCAD from December 2014 to August 2021 are shown below.
The Python code for the strategy is available here. It is important to note that backtesting results do not guarantee future performance. The presented strategy results are intended solely for educational purposes and should not be interpreted as investment advice. A comprehensive evaluation of the strategy across multiple parameters is necessary to assess its effectiveness.
All the concepts covered in this tutorial are taken from this Quantra course on Mean Reversion Strategies In Python. You can take a Free Preview of the course and learn all these concepts in detail.
Note: The links in this post will be accessible only after logging into quantra.quantinsti.com

Decoding Mean Reversion in Capital Markets
Capital markets are a dynamic ecosystem, constantly shifting and adapting. Amidst this volatility, the Mean Reversion principle emerges as a strategic beacon. At its core, mean reversion trading hinges on a simple yet profound notion: what goes up must come down, and what falls too far is likely to bounce back. This foundation is built upon the idea that asset prices, amidst short-term fluctuations, possess an inherent tendency to gravitate back towards their historical averages over time.
In today’s classroom, let’s create a trading strategy based on the mean reversion of prices and analyse its performance. For this study, we will use the daily prices of the forex contract Australian Dollar / Canadian Dollar (AUDCAD) from December 2014 to August 2021.
The following are the three parts involved in this study.
Part-1: Calculate the moving average, upper and lower bands
Part-2: Define the entry and exit rules of the strategy
Part-3: Performance Analysis
Part-1: Calculate the moving average, upper and lower bands
Calculating the Moving Average:
At the heart of our strategy lies the moving average – a powerful tool that smooths out price fluctuations and reveals the underlying trend.
For this study, we're focusing on a 5-day moving average. This means that each day, we'll take the average of the past five days' closing prices. This calculated average becomes a key reference point, allowing us to discern whether the current price is above or below the recent trend.
Establishing Bands Using Standard Deviation:
Accompanying our moving average are the upper and lower bands, which provide crucial insights into potential price deviations.
In this study, we're setting the bands at 0.5 standard deviations from the moving average. Standard deviation measures the dispersion of prices around the moving average, and by placing the bands at this distance, we aim to capture instances where prices have strayed significantly from the recent norm.
When prices breach these bands – either the upper or lower – it triggers our attention. A breach suggests that the market may have overreacted to recent developments, potentially presenting an opportunity for mean reversion.
Upper Band = Moving Average + (Standard Deviation * Number of Standard Deviations)
Lower Band = Moving Average - (Standard Deviation * Number of Standard Deviations)
Where:
- The Upper Band is the upper boundary indicating potential overbought conditions.
- The lower Band is the lower boundary, indicating potential oversold conditions.
- Moving Average is the calculated average of asset prices over a specific period.
- Standard Deviation is a measure of price dispersion around the moving average.
- The number of Standard Deviations is the chosen factor to determine how wide the bands should be from the moving average.
For example, if you have a 5-day moving average and you want to set the bands at 0.5 standard deviations away, the formula would be:
Upper Band = 5-day Moving Average + (0.5 * Standard Deviation of 5-day Prices)
Lower Band = 5-day Moving Average - (0.5 * Standard Deviation of 5-day Prices)
Keep in mind that the specific data points used in the calculations (such as the period for the moving average and the historical price data) will determine the values of the moving average, standard deviation, and consequently, the upper and lower bands. These values will then guide your trading decisions based on how prices interact with the bands.
Part-2: Define the entry and exit rules of the strategy
Long Position Entry and Exit:
The journey of a mean reversion trade begins when the price dips below the lower band, indicating a potential oversold condition. This presents an opportunity to enter a long position, speculating that the price will eventually revert back to its moving average. The rationale behind this is that an oversold market has potentially overshot its decline, and the natural tendency is for prices to return to a more balanced state.
Once the long trade is initiated, our focus shifts to the exit strategy. We exit the long position when the price rebounds and returns to the moving average. This is the moment when the market has shown signs of correcting itself and reverting to its recent trend. The objective of this exit rule is to capture profits.
Short Position Entry and Exit:
Conversely, the strategy also encompasses short positions. A short position is entered when the price breaches the upper band, signalling a potential overbought condition. This suggests that the market might have become overly enthusiastic, driving the price above its recent trend. By entering a short position, we aim to profit from an anticipated price correction as it returns to the moving average.
Similar to the long position, the exit strategy for a short trade is tied to the price movement . The short trade is exited when the price retraces and returns to the moving average. This signals that the initial overbought conditions are potentially normalising , offering an opportunity to lock in gains from the downward mean reversion movement.
Part-3: Performance Analysis
Here is the plot of cumulative returns of the strategy backtested based on the trading rules defined above. This strategy was backtested from December 2014 to August 2021 on the AUDCAD contract.

A cumulative return of 1.28 means that the capital has increased by 28% over the backtest period. The performance strategy can be improved by changing the look back for the moving average and the number of standard deviations to create the bands. It is important to note that backtesting results do not guarantee future performance. The presented strategy results are intended solely for educational purposes and should not be interpreted as investment advice. A comprehensive evaluation of the strategy across multiple parameters is necessary to assess its effectiveness.
Conclusion
In wrapping up our exploration of Mean Reversion in capital markets, we've unveiled a potent trading concept that holds the potential to unlock new opportunities. The core principle of mean reversion, where prices tend to revert to their historical averages, serves as a guiding light amid the market's fluctuations.
To learn the concepts learned in today’s classroom in a step-by-step fashion, head to our course on Mean Reversion Strategies In Python.
What to do next?
- Go to this course
- Click on
- Go through 10-15% of the course content

Drop us your comments, and queries on the community
IMPORTANT DISCLAIMER: This post is for educational purposes only and is not a solicitation or recommendation to buy or sell any securities. Investing in financial markets involves risks and you should seek the advice of a licensed financial advisor before making any investment decisions. Your investment decisions are solely your responsibility. The information provided is based on publicly available data and our own analysis, and we do not guarantee its accuracy or completeness. By no means is this communication sent as the licensed equity analysts or financial advisors and it should not be construed as professional advice or a recommendation to buy or sell any securities or any other kind of asset.


