Mean Reversion Strategy on Triple Assets
Here, we're diving deeper into the dynamic world of mean reversion strategies, extending our focus to triplets of instruments instead of pairs. What happens if a pair of assets showing mean reversion characteristics in the past does not display these characteristics in future? Can we reduce the drawdowns as a result of increasing spread?
The answer is yes, we tested a mean reversion strategy on triplet assets and these were the results:
It is important to note that backtesting results do not guarantee future performance. The presented strategy results are intended solely for educational purposes and should not be interpreted as investment advice. A comprehensive evaluation of the strategy across multiple parameters is necessary to assess its effectiveness.
All the concepts covered in this email are taken from the Quantra course on Mean Reversion Strategies in Python. You can preview the concepts taught in this course by clicking on the free preview button and going to Section 9 and Unit 14 of the course.
Note: The links in this tutorial will be accessible only after logging into quantra.quantinsti.com
The Importance of Cointegration
When you think of mean reversion, the first strategy that comes to mind is Pairs Trading, but what if a cointegrated pair displaying mean-reverting characteristics in the past does not hold the same characteristics in future? For instance, in 2011 the GLD-GDX spread rose dramatically. When the spread keeps increasing instead of reverting back to the mean, the combined position that we take in the instruments would result in losses. We took the combined positions on GLD-GDX using Bollinger Bands and these were the results:
So what’s the remedy? Adding another asset to the pair!
But how do we know which asset would fix the increase in spread? Well, in such cases, a grasp of the fundamental economics behind the pair helps identify potential disruptions. For instance, if we take a look at the past data, rising oil prices impacted the GLD-GDX pair in 2008. Therefore, to add the third asset you need to know the fundamentals first. Since we know that rising oil prices have an impact on the spread, in this scenario, the inclusion of USO (United States Oil Fund) aims to rectify the breakdown witnessed during the 2008 crisis.
Now that we have selected the third asset based on fundamentals, the next step is to ensure cointegration.
Johansen Test for Cointegration
The Cointegration Augmented Dickey-Fuller (CADF) test is used to determine whether there is cointegration between two time series variables. Unlike the CADF test, the Johansen test is flexible and can handle multiple sets of data. It is a powerful tool to check if different sets of data move together.
To verify that adding USO will cure the breakdown of cointegration, we simply included it in the Johansen test and checked whether stationarity holds during the financial crisis in 2008. We found that a stationary spread can indeed be created using the three ETFs. The eigenvector obtained through the Johansen test is used to determine the hedge ratio. That is, it will provide us with an equation specifying the portfolio weights for the three instruments, i.e spread is equal to GLD plus h1 times GDX plus h2 times USO.

These hedge ratios will be computed for the first 90 days of our dataset to avoid any look ahead bias while backtesting.
Mean Reversion on Triplets: Strategy Implementation
Armed with this knowledge, let's implement a mean reversion strategy to triplets, using the example of GLD-GDX-USO. As mentioned earlier, the inclusion of USO aims to rectify the breakdown witnessed during the 2008 crisis. The Johansen Test results confirm cointegration and provide hedge ratios for portfolio weights.
Entry:
Trade positions will be opened based on the value of the spread, i.e. whenever it crosses the upper band we can open a short position. On the other hand, whenever it crosses the lower Bollinger Bands we can open a long position.
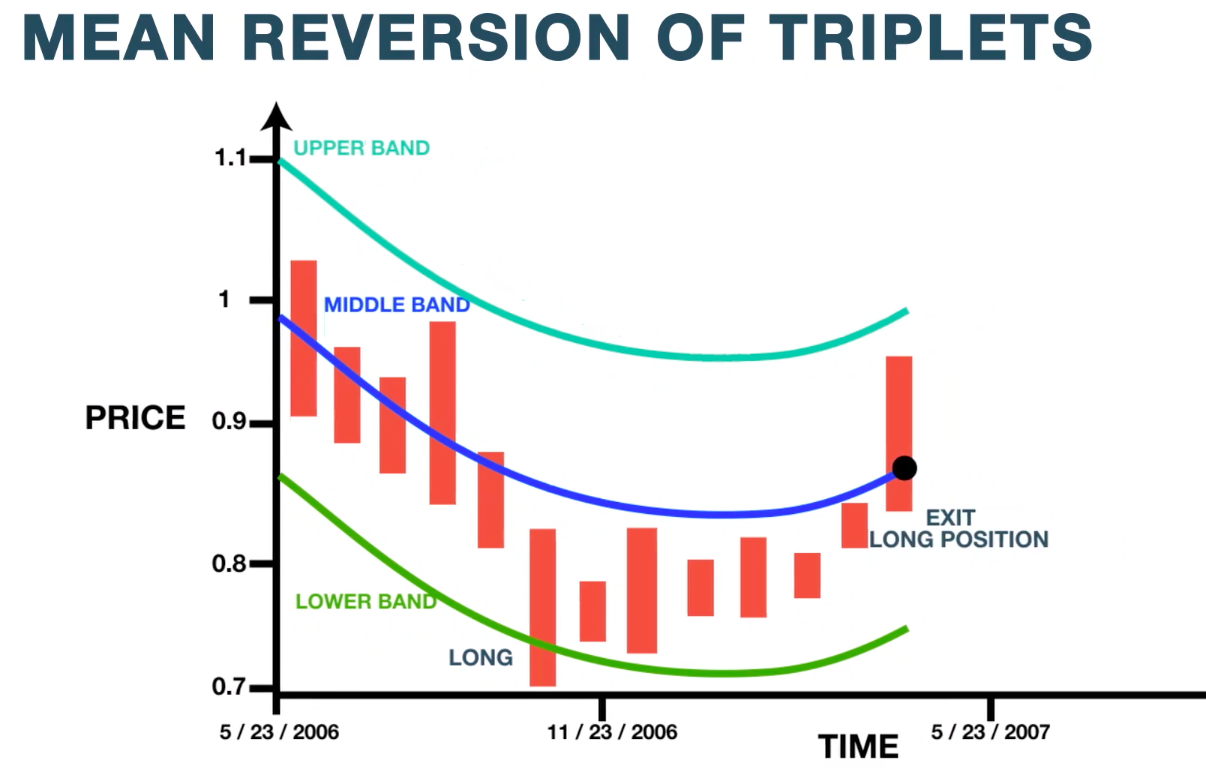
Exit:
Open positions will then be closed when the spread reverts back to the mean.
Here we are buying and selling the spread, which implies taking appropriate positions in the three instruments that form the spread according to their weights. Let us look at how we will identify the weight coefficients for our triplet.

The spread is equal to GLD minus 1.38 times GDX plus 0.05 times USO. Therefore, buying the spread would imply buying 1 unit of GLD, shorting 1.38 units of GDX and buying 0.05 units of USO. These positions will be closed when the spread rises and reverts back to the mean.
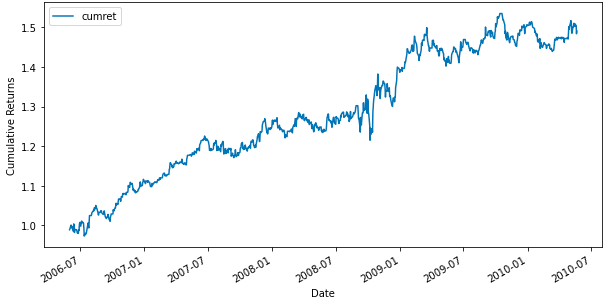
Results:
The strategy returns graph showcases that adding USO eliminates the drawdown experienced in 2008.
It is important to note that backtesting results do not guarantee future performance. The presented strategy results are intended solely for educational purposes and should not be interpreted as investment advice. A comprehensive evaluation of the strategy across multiple parameters is necessary to assess its effectiveness.
In conclusion, when the spread of two assets used in a typical pairs trading strategy increases, you may be able to rectify it by adding a third asset to the picture. In this classroom, we have explored how you can select the third asset, check its cointegration and improve the strategy by taking positions based on weights. To learn how to implement the mean reversion on triplets strategy using Python, you can get a free preview of section 9 unit 14 of the “Mean Reversion Strategies in Python” course on Quantra.
What to do next?
- Go to this course
- Click on
- Go through 10-15% of course content
- Drop us your comments and queries on the community

IMPORTANT DISCLAIMER: This email is for educational purposes only and is not a solicitation or recommendation to buy or sell any securities. Investing in financial markets involves risks and you should seek the advice of a licensed financial advisor before making any investment decisions. Your investment decisions are solely your responsibility. The information provided is based on publicly available data and our own analysis, and we do not guarantee its accuracy or completeness. By no means is this communication sent as the licensed equity analysts or financial advisors and it should not be construed as professional advice or a recommendation to buy or sell any securities or any other kind of asset.


