How to backtest a trading strategy
In trading, your strategy is everything. But how do you know if it's solid? Take the Moving Average Convergence Divergence (MACD) indicator-based strategy, for example. But how can you gauge its profitability? This is where backtesting comes in.
It's testing your strategy against historical data to see if it works. However, effective backtesting goes beyond crunching numbers; it involves studying backtest results, optimising strategy parameters, and managing risk metrics.
In this Quantra classroom, we'll delve into the intricacies of backtesting, understand the effective way to backtest and then study the results to gain insights into the performance of the trading strategy. If you want to learn in detail about backtesting, take a free preview of the course ‘Backtesting Trading Strategies’.

All the concepts covered in this email are taken from the Quantra courses Backtesting Trading Strategies and Swing Trading Strategies. You can preview the concepts taught in this classroom by clicking on the free preview button and navigating to the respective sections of the courses.
Note: The links in this tutorial will be accessible only after logging into quantra.quantinsti.com
The following topics are covered in this Quantra Classroom:
- What is backtesting?
- What is the need to backtest a trading strategy?
- What are the steps involved in backtesting?
- How to study backtest results for performance analysis?
- What are the limitations of backtesting?
What is Backtesting?
In the world of trading, backtesting is a critical tool that allows traders to assess the viability and effectiveness of their trading strategies. Simply put, backtesting involves applying a trading strategy to historical market data to evaluate its performance. It's like a virtual laboratory where traders can simulate their strategies against past market conditions to see how they would have fared.
What Is the Need to Backtest a Trading Strategy?
Backtesting is crucial because it provides insights into the strengths and weaknesses of your strategy based on historical data. By assessing how your strategy would have performed in the past, you gain valuable information that helps refine and optimise your approach. Without backtesting, you're essentially navigating blindly, risking capital without a clear understanding of your strategy's potential. Whether you're a seasoned trader or new to the game, integrating backtesting into your routine is essential for refining your approach.
You can learn more about backtesting and its importance by watching the video in the course Backtesting Trading Strategies.

What are the Steps Involved in Backtesting?
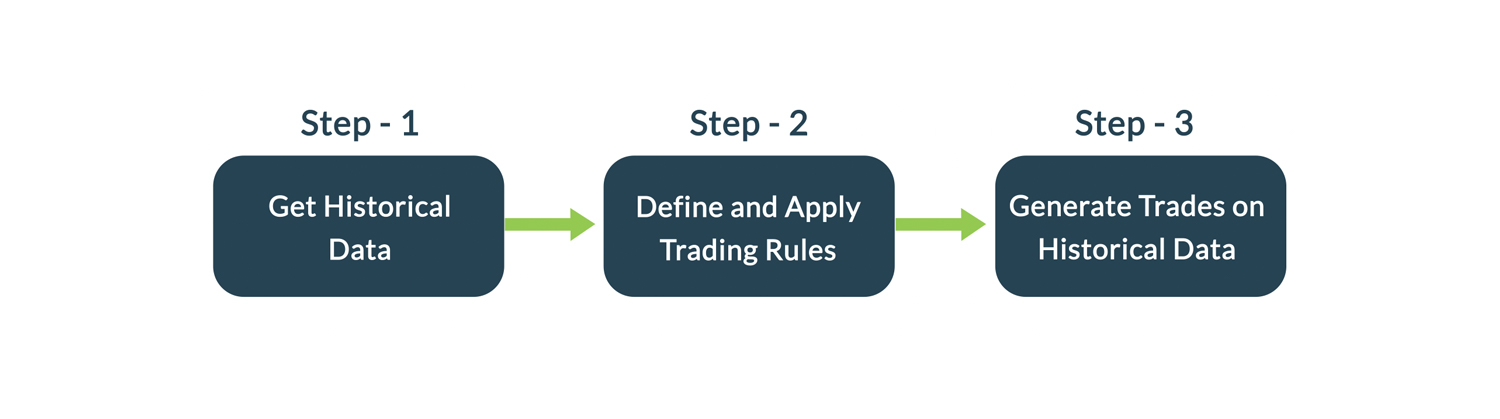
Figure: Steps Involved in Backtesting A Trading Strategy
For example, consider you want to backtest a technical analysis indicator-based trading strategy like MACD on AAPL from 2010-01-04 to 2020-08-31. You would perform the following steps.
Step-1:
Get Historical data: Collect data from trusted data sources or APIs for high-quality error-free data. The following is the hourly data of AAPL from 2010-01-04 to 2020-08-31. The minute data of AAPL is collected from the Python package, yfinance and resampled into hourly data.
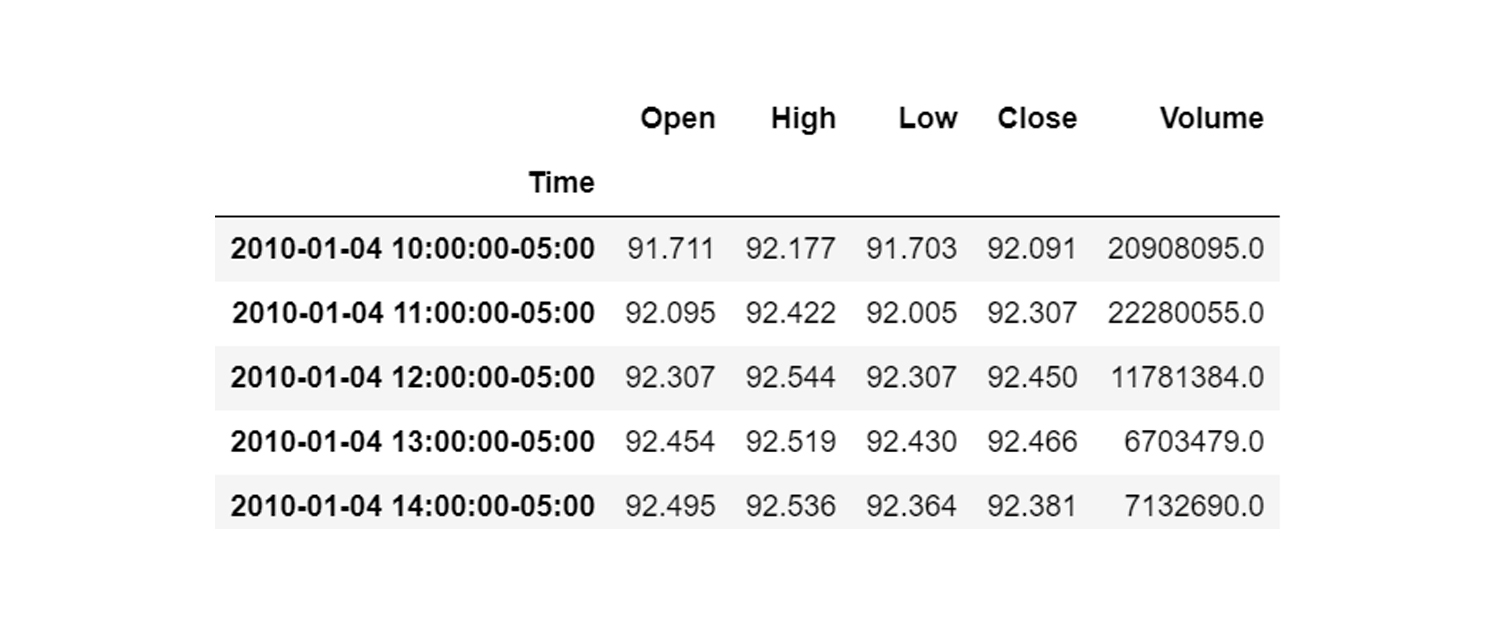
Fig: Hourly Price Data of AAPL
Step-2:
Define and Apply the Trading Rules: Define the entry and exit rules of the trades based on the strategy. In the case of strategy based on the MACD indicator, the following entry and exit rules can be considered.
Entry rule: The entry rule defines the condition to open a position based on the strategy. For the MACD indicator-based strategy, the entry rule could be:
Buy if: MACD line > Signal line
Exit rule: The exit rule defines the condition to close the open position. This exit rule can majorly be of three types
1. Exit based on the strategy: The exit rule can be related to the strategy itself. For example, for a position opened based on the MACD indicator, the exit rule can be
Sell if: MACD line < Signal line
2. Exit based on the holding period: The exit rule can be defined such that an open position will be closed after holding for a certain period, say one month.
Sell if: Holding period > One month
3. Exit based on risk management: If you have a long open position and the stop loss or profit target hit, you will close the long position. For illustration purposes, the risk-reward ratio of 1:2 is used. We can use 2% below the entry price as a stop-loss target, and since the risk-reward ratio is 1:2, the profit target will be 4% above the entry price.
Sell if: Close Price > Profit target
Sell if: Close Price < Stop-loss
Step-3:
Generate trades on the historical data: The above steps are done for the historical data collected and whenever a trade is opened or closed, the trade details such as price, time, and quantity are recorded to generate the trade sheet. The entry and exit information of the trades are used to calculate the PnL of the trades. It should be noted that the entry price represents the price at which the long position was opened on ‘Entry Time’ and the exit price represents the closing price of the long trade on ‘Exit Time’ whereas the ‘PnL’ represents the profit/loss value of the trade.
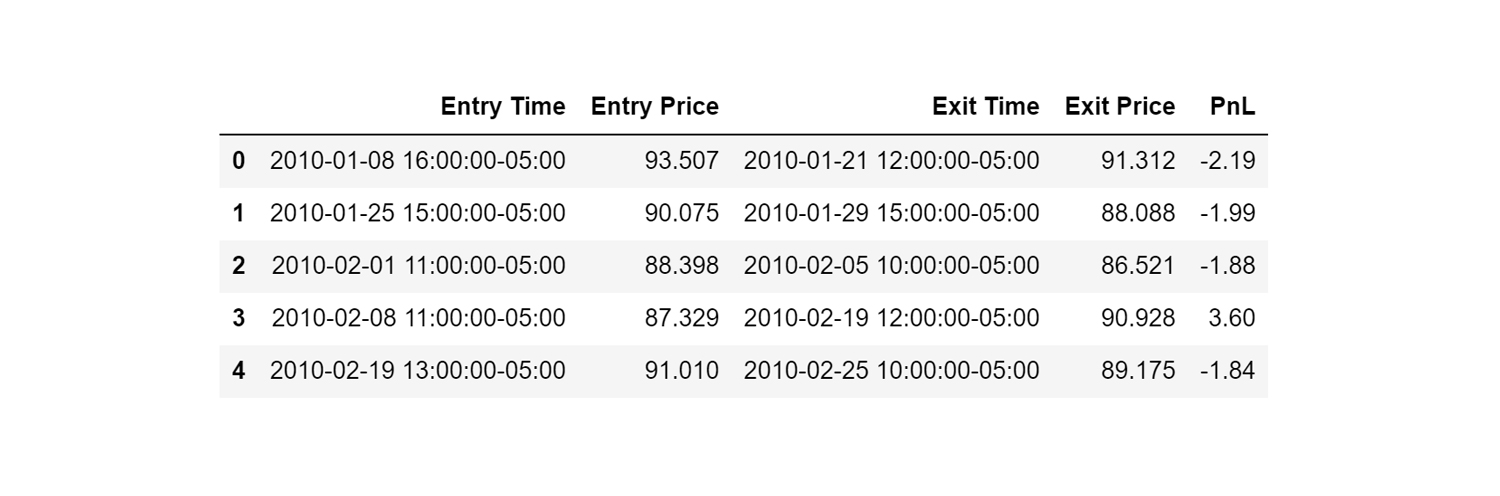
Fig: Trade Details of MACD-Based Strategy on AAPL
How to Study Backtest Results for Performance Analysis?
Studying the performance of your backtested trading strategy is crucial for refining and optimising your approach. A review of trade parameters and a study of the performance metrics give insights into the backtest results of the strategy.
Review Trade Parameters: Start by reviewing the parameters of your trading strategy. This includes the number of trades during the backtest, duration of the backtest, average holding period per trade etc.
The following are the trade parameters for the MACD strategy deployed on AAPL.
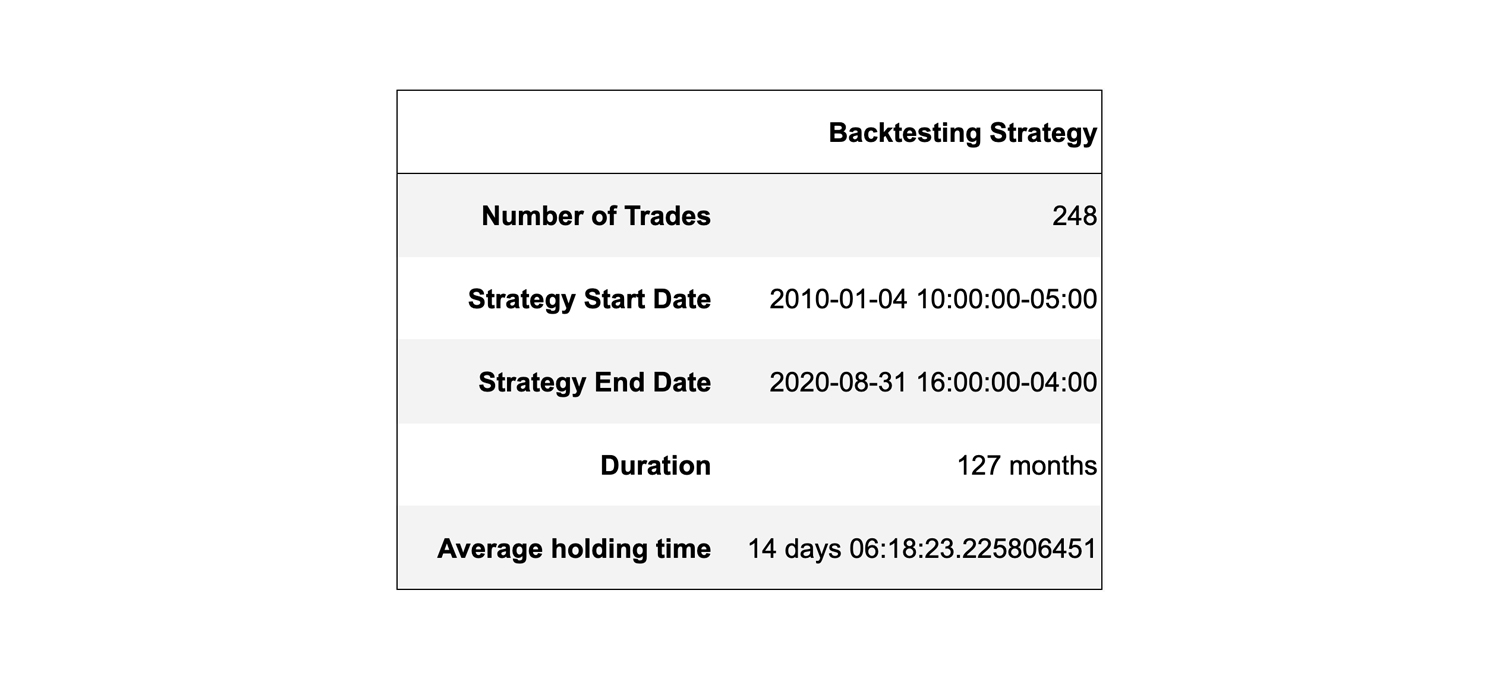
Figure: Trade Parameters of Backtest on MACD-Based Strategy
These parameters will give a basic idea of the strategy such as the frequency of trades and holding duration. Post this, a more detailed analysis of the trades can be done using the performance metrics.
Analyse the Performance Metrics: The metrics that provide insight into the strategy performance are divided into three categories:
- Return metrics
- Risk metrics
- Return per risk metrics
1. Return metrics: Return metrics provide insight into the profitability and overall performance of your trading strategy. These metrics focus on the returns generated by your trades and can include measures such as:
- Cumulative returns: The total gain or loss of an investment over a specified period, including all gains and losses realized during that time.
- Annualised returns: It is the average annual return of a strategy.
- Profit factor: It is the ratio of the sum of profit to the sum of loss.
- Win rate: The percentage of trades yielding positive returns for the strategy.
The following are the return metrics for the MACD strategy deployed on AAPL.
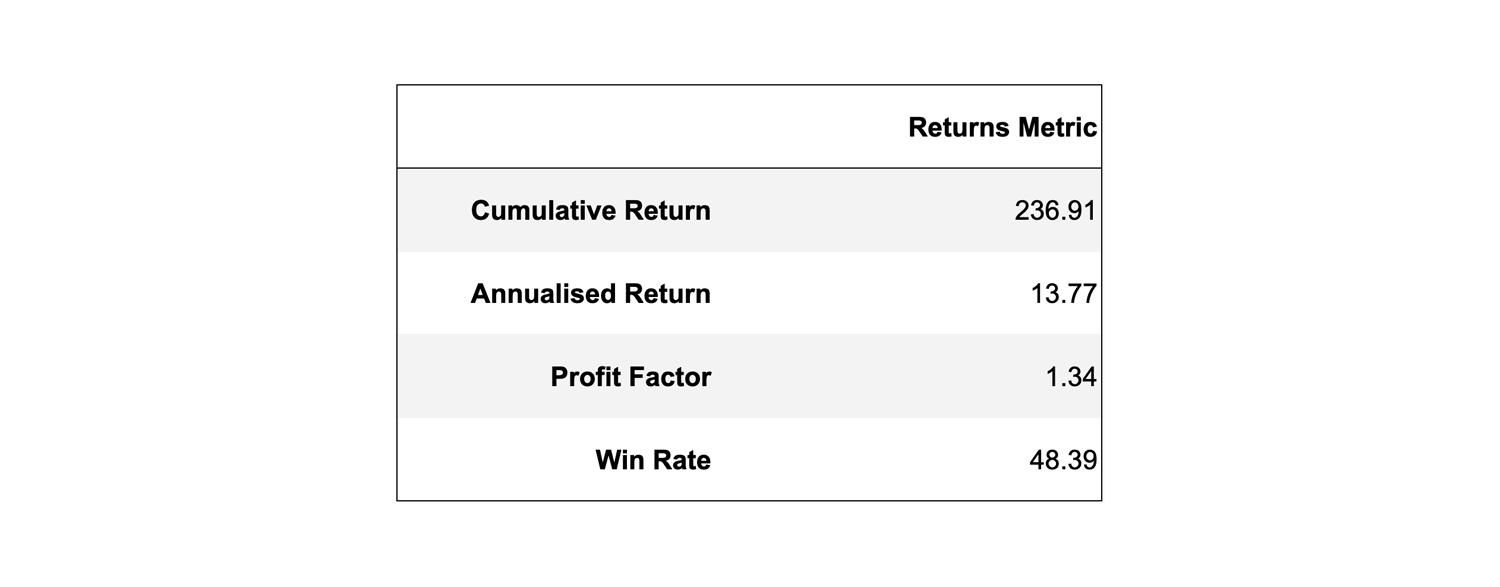
Figure: Returns Metrics of Backtest on MACD-Based Strategy
- Heatmap of the month versus year returns: It will help you analyse how the strategy performed in a given month across different years.
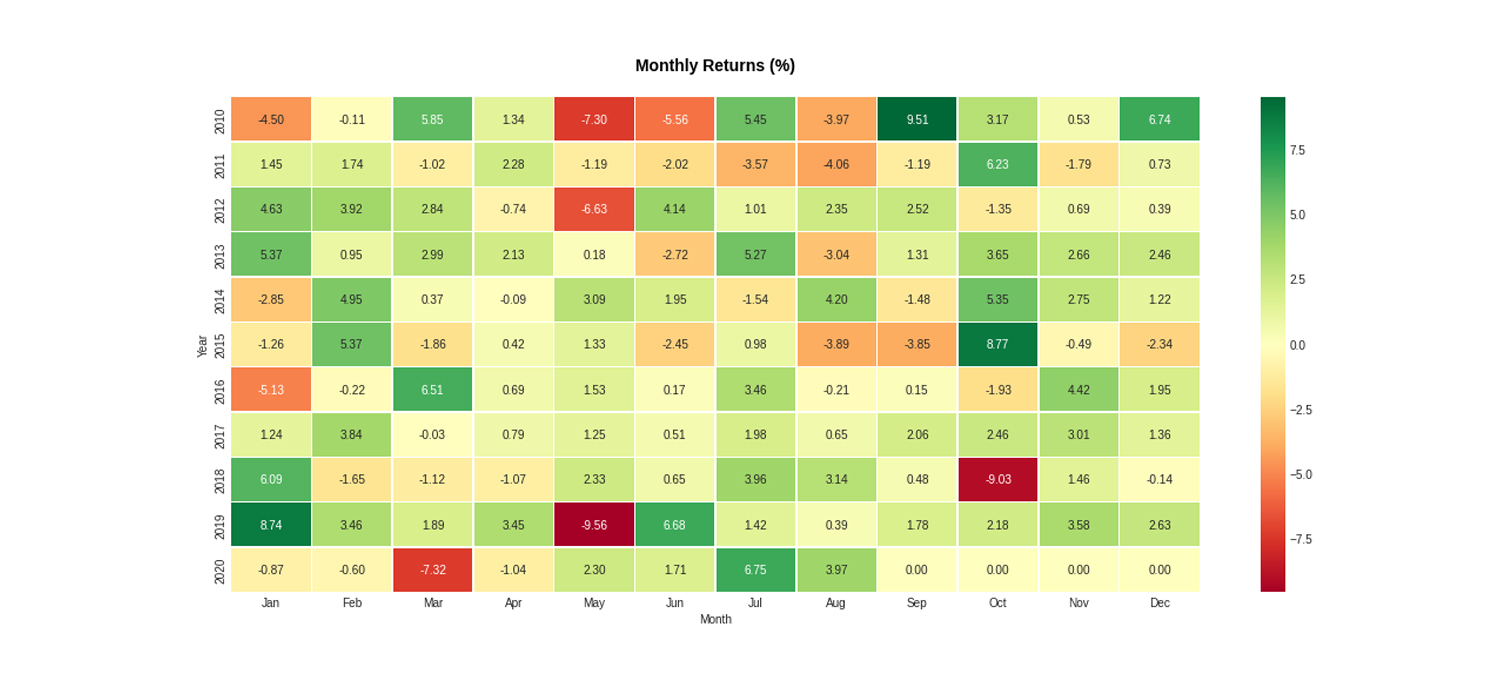
Fig: Monthly returns heatmap of Backtest on MACD-Based Strategy
The heatmap of month vs year can be utilised to identify any seasonal or monthly patterns, if they exist, in the returns of the backtested strategy
- Equity curve: You can use an equity curve to visualise how the portfolio value has changed over a period of time.
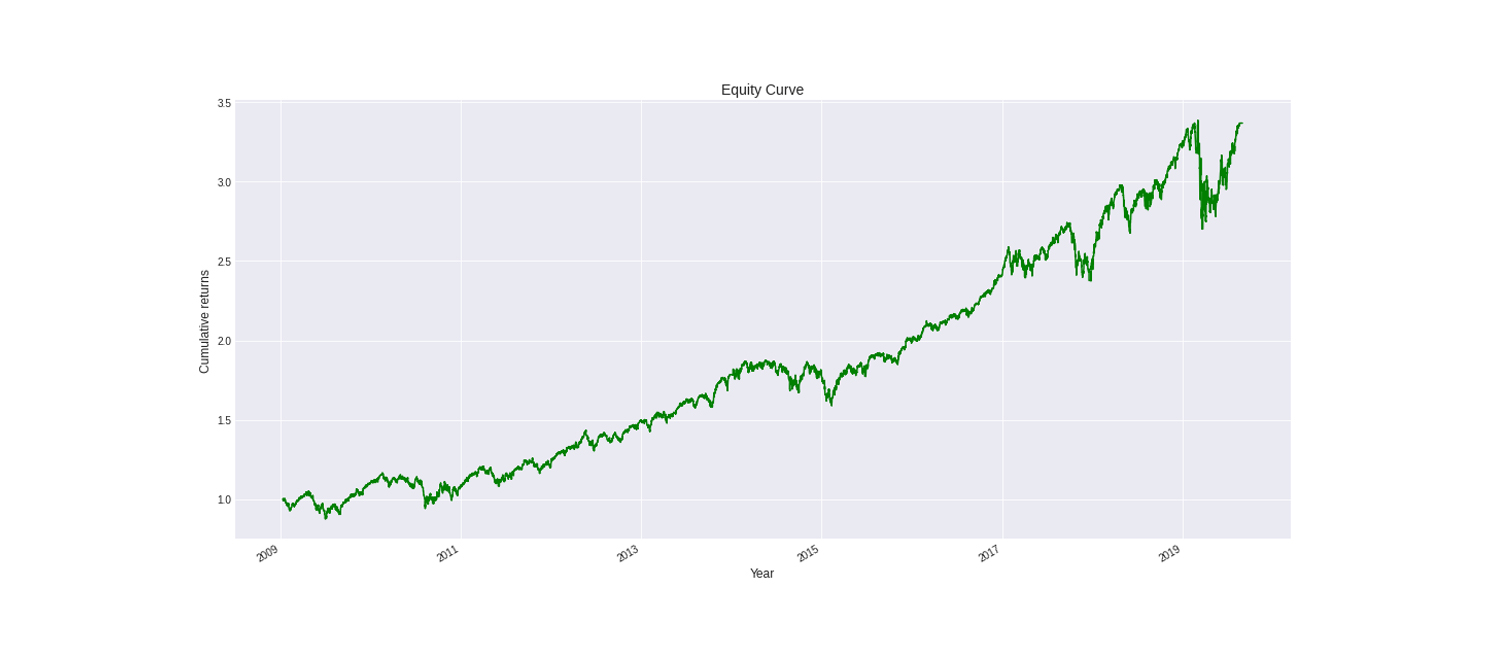
Fig: Equity curve of Backtest on MACD-Based Strategy
Note that backtesting results do not guarantee future performance. The presented strategy results are intended solely for educational purposes and should not be interpreted as investment advice.
To make the backtesting more closer to reality, transaction costs and slippages can also be added.
You can learn about transaction costs and slippages along with their calculations by watching the video in the course Backtesting Trading Strategies.

2. Risk Metrics: Metrics focused on risks will allow you to assess the risk associated with a particular strategy. The following are the risk metrics for the MACD strategy deployed on AAPL.
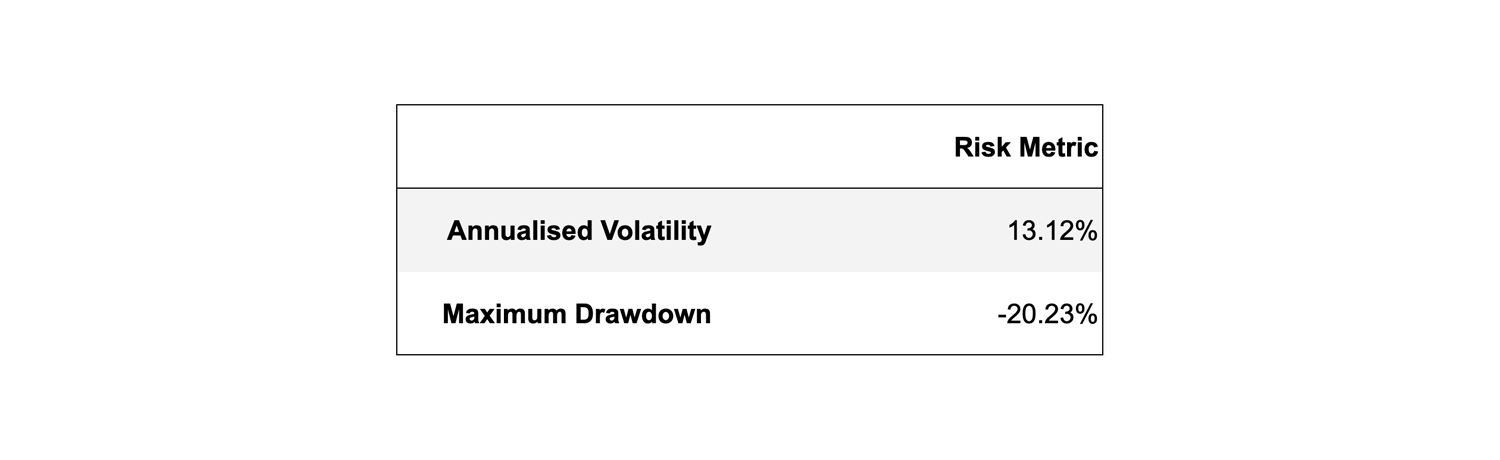
Figure: Risk Metrics of Backtest on MACD-Based Strategy
- Annualised volatility: Annualised volatility is a measure of change in the price over a year.
- Maximum drawdown: Maximum drawdown is the maximum value a portfolio lost from its peak. It is the maximum loss the strategy can make. The higher the value of the drawdown, the higher would be the losses.
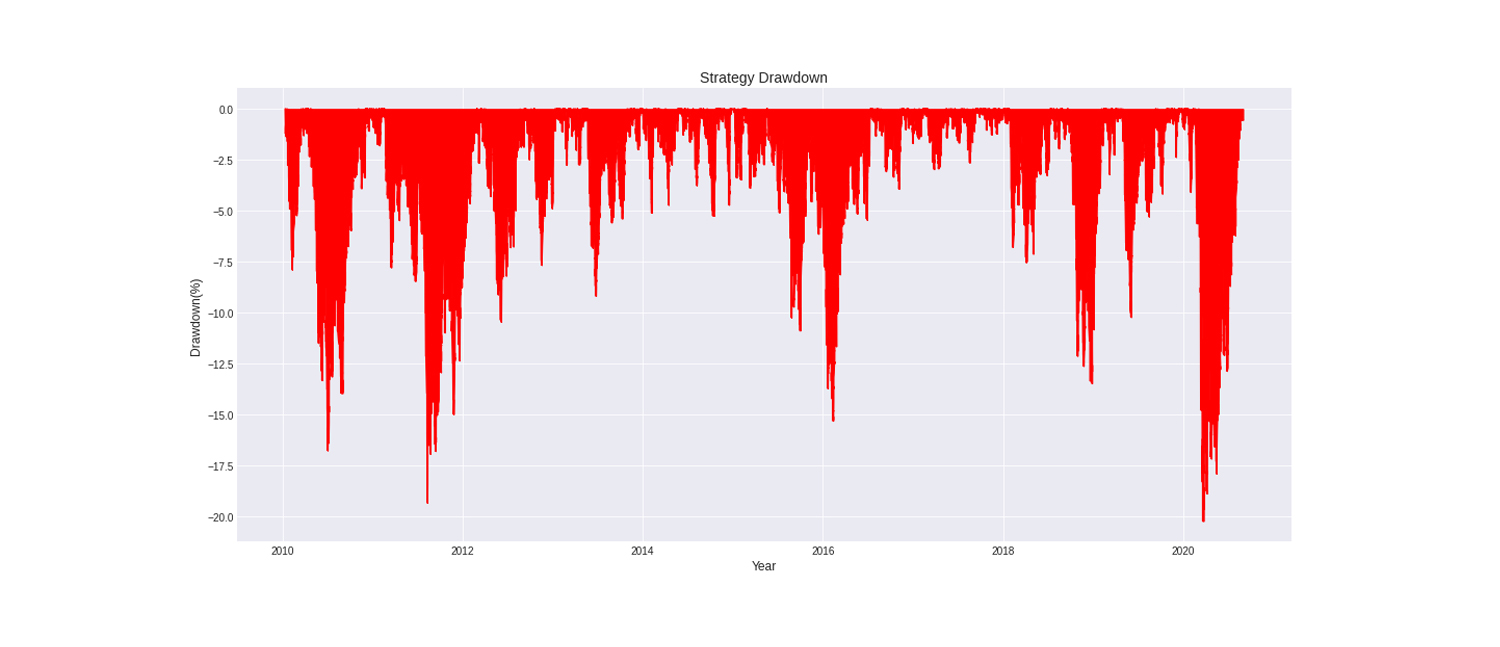
Fig: Drawdown of Backtest on MACD-Based Strategy
Now, how can we optimize the trading strategy based on performance analysis of backtest results?
For instance, considering the aforementioned risk metrics and the strategy drawdown plot, the maximum drawdown of this MACD-based strategy, with a stop-loss set at 2% below the entry price, is 20.23%.
If risking 20.23% of the portfolio value while employing the strategy makes you uncomfortable, you have the option to optimize the strategy parameters.
For instance, you can reduce the stop-loss value and conduct another round of backtesting to assess potential improvements in the maximum drawdown. However, it's essential to note that a thorough analysis of all performance metrics is crucial whenever you're optimizing the strategy parameters
The Python code to calculate and plot the above performance metrics is covered in the course Backtesting Trading Strategies.

What Are the Common Pitfalls of Backtesting?
Here are the top three most common pitfalls of backtesting:
Overreliance on Historical Performance: Backtesting relies on historical market data, which may not fully reflect current market conditions. Changes in market dynamics, liquidity, and volatility over time can lead to discrepancies between backtested results and real-world trading outcomes.
Overfitting: Overfitting occurs when a trading strategy is excessively tailored to historical data, resulting in inflated performance results that may not generalise well to future market conditions. This can lead to strategies that perform well in backtesting but fail to deliver in live trading due to unrealistic assumptions or data mining bias.
Transaction Costs and Slippage: Backtesting often overlooks transaction costs, such as commissions, fees, and slippage, which can significantly impact the profitability of a trading strategy in real-world trading. Ignoring these costs can lead to overly optimistic performance estimates and unrealistic expectations for traders.
These pitfalls highlight the importance of exercising caution when interpreting backtest results and incorporating additional analysis techniques to validate and refine trading strategies.
To know more details about the pitfalls in backtesting, refer to the section ‘Common Pitfalls in Backtesting’ of the course ‘Backtesting Trading Strategies’.
What to do next?
- Go to this course
- Click on
- Go through 10-15% of course content
- Drop us your comments and queries on the community

IMPORTANT DISCLAIMER: This email is for educational purposes only and is not a solicitation or recommendation to buy or sell any securities. Investing in financial markets involves risks and you should seek the advice of a licensed financial advisor before making any investment decisions. Your investment decisions are solely your responsibility. The information provided is based on publicly available data and our own analysis, and we do not guarantee its accuracy or completeness. By no means is this communication sent as the licensed equity analysts or financial advisors and it should not be construed as professional advice or a recommendation to buy or sell any securities or any other kind of asset.


