How to Trade Options Systematically?
It's very common for options traders to feel overwhelmed due to the unpredictability of the options market. Many traders follow their gut when trading options, leading to emotional ups and downs. Options trading requires a systematic approach instead of relying on instincts, which helps in navigating the unpredictable options market with confidence and control.
In this post, we will discuss a systematic way to approach options trading.
All the concepts covered in this post are taken from the Quantra course on Systematic Options Trading. You can preview the concepts taught in this course by clicking on the 'Start Free Preview' button.
Note: The links in this tutorial will be accessible only after logging into quantra.quantinsti.com


Note: The link will be accessible only after logging into quantra.quantinsti.com.

Note that backtesting results do not guarantee future performance. The presented strategy results are intended solely for educational purposes and should not be interpreted as investment advice.
This post is structured as follows:
Systematic Options Trading Process
Step 1: Retrieve, Store and Clean the Data
Step 2: Filter Options
Step 3: Define Entry and Exit Rules
Step 4: Evaluate the Performance
Step 5: Optimisation
Step 6: Forward Testing
If you are new to options trading, check out our free course ‘Options Trading Strategies In Python: Intermediate’.
Systematic Options Trading Process
The systematic options trading process is a methodical approach to trading options, based on a well-defined set of rules. This process relies on data analysis, quantitative models, and automated systems to execute trades, aiming to minimise human emotions and biases.

The systematic options trading process involves 6 steps.
Step 1: Retrieve, Clean and Store the Data
The first step in the systematic trading process is to retrieve, store, and clean the data. This data can come from paid vendors or free sources like Yahoo Finance and Google Finance.
For options trading, you need data on the underlying asset (Open, High, Low, Close) and its options (type, historical price, volume, open interest, strike price, expiry). Additionally, derived data such as implied volatility and options Greeks are helpful. For event-based or long-term strategies, fundamental data like corporate events and quarterly reports are necessary.
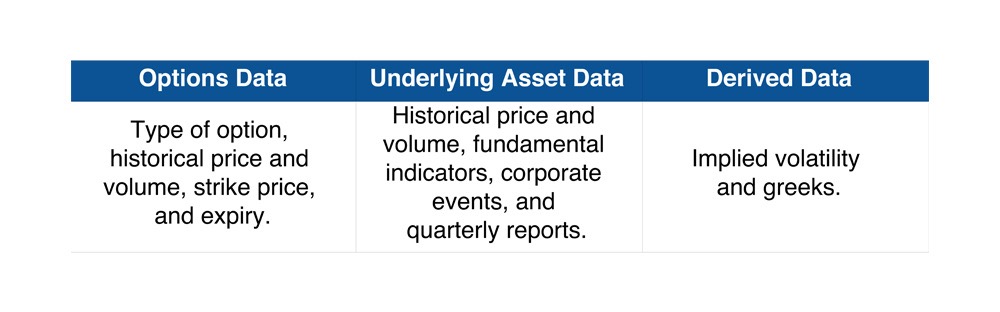
For example, for the underlying asset like the S&P 500 index, the information on macroeconomic reports can be considered fundamental data while the options contracts data of SPX, and XSP can be considered as options data.
Once the data is retrieved, we should perform data quality checks such as checking for missing values, outliers and robustness. It should be noted that the better the quality of the data, the better the systematic trading process.
Once the data is cleaned, the options data, underlying asset data and derived data can be in separate pickle files. For example, storing the data as a pickle file with the .bz2 extension not only saves disk space by compressing the data, it also preserves the exact data types and structures. Alternatively, the data can be stored in databases such as the ORACLE database or Microsoft Access.
However, even for a single asset, it is a herculean task to collect, clean and store the above data for all the options contracts for each strike price. Hence, you need to create a screener to filter out the irrelevant data.
Step 2: Filter Options
For every asset, there are many options contracts based on the type of option, expiry and strike price. For effective systematic trading, you should create screening criteria to select the relevant options data. This would help to select the relevant options data instead of analysing hundreds of options contracts per day.
For example, the S&P 500 index has options contracts that expire daily, weekly, and monthly. If you wish to trade only weekly expiry options, the first step of filtering is to select the weekly options contract. Next, you can filter out the illiquid options contracts related to the strike prices with either bid or ask as 0. Once the liquid options contracts of relevant expiry are selected, they can be further filtered by selecting the options contract with high open interest.
To know more about creating an options screener, refer to the video in section 5 unit 1 of the course ‘Systematic Options Trading’.

Step 3: Define Entry and Exit Rules
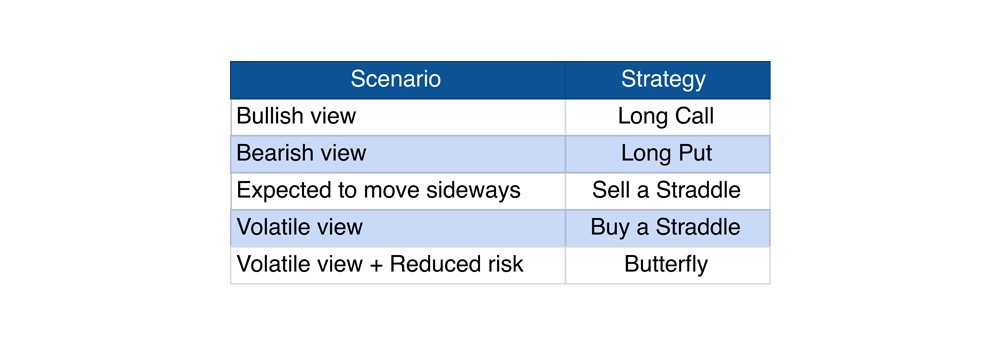
The options strategy is selected based on the market view and risk management. A view of the market can be formed based on the direction and volatility. For example, based on the expected market direction, a bullish, bearish or sideways view can be developed. Similarly, based on your analysis of market volatility, a volatility view can be developed. The following are the example options strategies based on the market view.
Every strategy has a payoff that gives information about the maximum profit and loss of the strategy. Depending on the options strategy selected and its payoff, define the entry and exit rules of the strategy.
To know more about selecting the options strategy based on your market view, refer to the ‘Options Strategy Selector’ by clicking the following button.

Step 4: Evaluate the Performance
Once a strategy is selected and its exit and entry conditions are defined, evaluate its performance in the historical time period. This can be done by backtesting where the trades are taken based on entry and exit conditions in the past.
For example, for a short butterfly spread strategy, the entry and exit conditions can be based on implied volatility rank (IVP) and ADX indicator to confirm the volatility and trend characteristics. The exit conditions can also include risk management measures such as stop-loss and take-profit.
Based on the performance of the strategy in the past, we can extract insights such as average profit, and maximum loss that can be expected from this strategy using the performance metrics Sharpe ratio, maximum drawdown, annualised volatility, compound annual growth rate (CAGR), profit and loss analysis.
For example, here is the performance of a short butterfly spread strategy of the NIFTY50 index from Jan 2019 to April 2022.

Click the following button for Python code to perform strategy analysis of a short butterfly spread strategy.

Step-5: Optimisation
The strategy performance can be improved by optimisation. This is done by tweaking the parameters of the strategy either to maximise the profit or minimise the risk or both. For example, you can tweak the parameters such as stop-loss and take-profit of the strategy in the backtest to optimise. However, it should be noted that optimising multiple parameters of the strategy often leads to overfitting to the backtest period. This overfitting results in a strategy that performs well on historical data but fails to generalise to new, unseen data, thereby reducing the reliability and efficiency of the backtest.
Step-6: Forward Testing
It should be noted that the strategy was only backtested based on past data. Even though the strategy is profitable on historical data, it doesn’t make it reliable and can’t always guarantee similar future returns. Hence, you should also test the strategy on the current market scenario. This process is termed as forward testing or paper trading. Once the results in forward testing are satisfactory, you can deploy the same strategy in live markets.
What to do next?
- Go to this course
- Click on "Free Preview"
- Go through 10-15% of course content
- Drop us your comments and queries on the community
IMPORTANT DISCLAIMER: This email is for educational purposes only and is not a solicitation or recommendation to buy or sell any securities. Investing in financial markets involves risks and you should seek the advice of a licensed financial advisor before making any investment decisions. Your investment decisions are solely your responsibility. The information provided is based on publicly available data and our own analysis, and we do not guarantee its accuracy or completeness. By no means is this communication sent as the licensed equity analysts or financial advisors and it should not be construed as professional advice or a recommendation to buy or sell any securities or any other kind of asset.


