How to Construct a Portfolio using Modern Portfolio Theory
Do you find it difficult to figure out the best combination of stocks to hold in your portfolio?
What if we tell you that there’s a way to do this by applying some mathematical concepts? The Modern Portfolio Theory (MPT) is all about managing your portfolio to get improved risk-adjusted returns.
In this post, we'll explore this popular framework for managing portfolios using quantitative techniques. There are other techniques too which can be found in the Quantitative Portfolio Management course of Quantra.

All the concepts covered in this post are taken from the Quantra course Quantitative Portfolio Management. You can preview the concepts taught in this post by clicking on the free preview button and going to Section 3 and Unit 1 of the course.
Note: The links in this tutorial will be accessible only after logging into quantra.quantinsti.com
Note that backtesting results do not guarantee future performance. The presented results are intended solely for educational purposes and should not be interpreted as investment advice.
In this post, we will cover the following topics:
- What is Modern Portfolio Theory?
- Finding Optimal Stocks and Weights
- The Efficient Frontier
- Assumptions of MPT
We have implemented MPT using Python, therefore, if you’re new to Python then you’ll find the free course on Python for Trading: Basic quite helpful.
What is Modern Portfolio Theory?
Think about this – if you want to create a portfolio consisting of two stocks i.e. Microsoft and Google, how will you allocate capital to each of the stocks? You could either:
- Allocate more capital to the stock that is riskier but give better returns.
- Or you can go for a risk-averse approach and allocate more capital to the stock which is less risky but offers lower returns.
Is there a way to strike the right balance between risk and return?
Modern Portfolio Theory, developed by Harry Markowitz, is all about improving your portfolio's returns for a given level of risk.
Essentially, MPT helps you figure out which stocks to include in your portfolio as well as the best combination of those stocks to improve your returns while minimising risk. Buckle up and get ready to learn how to optimise your portfolio like a pro.

Finding Optimal Stocks and Weights
One of the core principles of MPT is diversification. But not just any diversification – we're talking about smart diversification. This means choosing stocks that don't move in lockstep with each other. In other words, you want stocks with low or negative covariance.
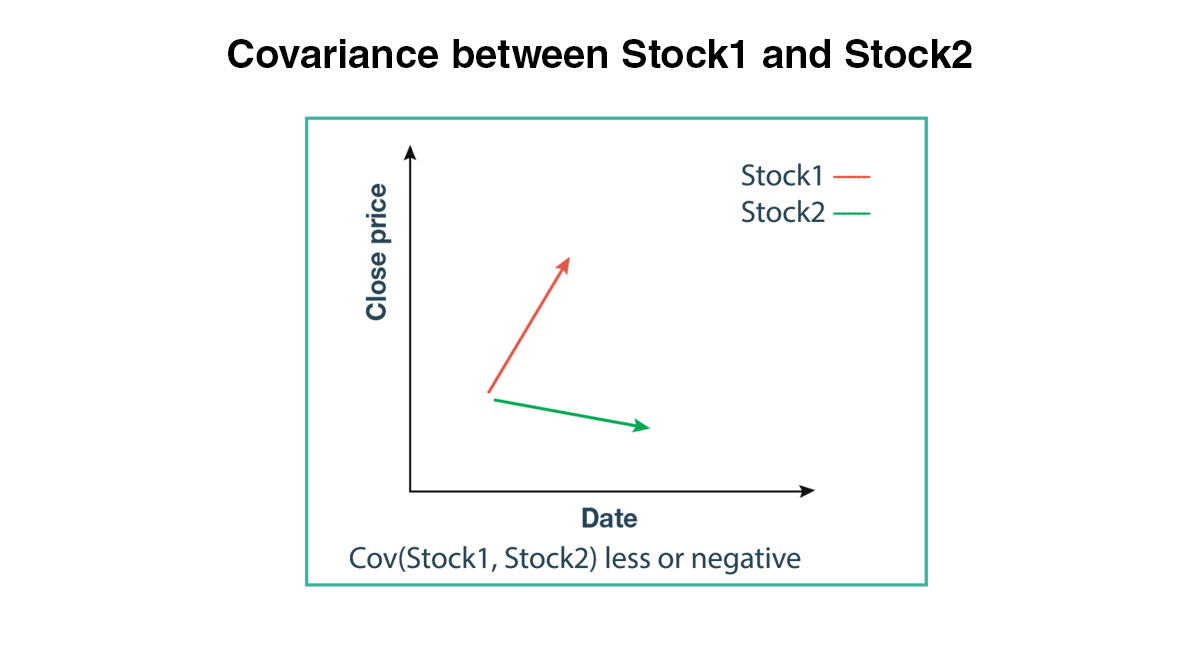
Figure: Covariance between Stock1 and Stock2
For instance, if the covariance between Microsoft and Google is 0.02 and the covariance between Microsoft and Chevron is 0.009. Then in addition to Microsoft, you might consider adding Chevron instead of Google to your portfolio. Why? Because the covariance between Microsoft and Chevron is lower than between Microsoft and Google, leading to a lower overall portfolio risk.
But it's not just about picking the right stocks. It's also about allocating your capital wisely. By adjusting the weights of the stocks in your portfolio, you can find the optimal mix that improves your returns for your desired level of risk. And there are so many different combinations of weights that you can assign to just two stocks of a portfolio. As you change the combination of weights, the returns and risk of your portfolio will also change.
In the image below, all three circles represent a portfolio with different weights for the two stocks:
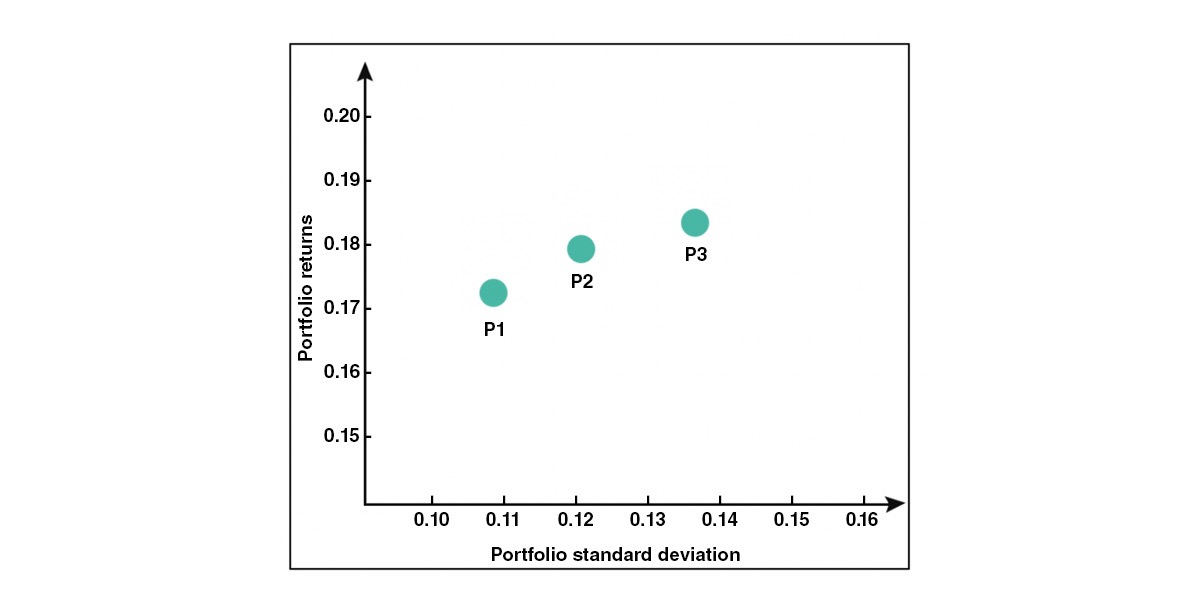
Figure: Portfolio with Different Weights for the Two Stocks
Stock Weights for Each Portfolio:
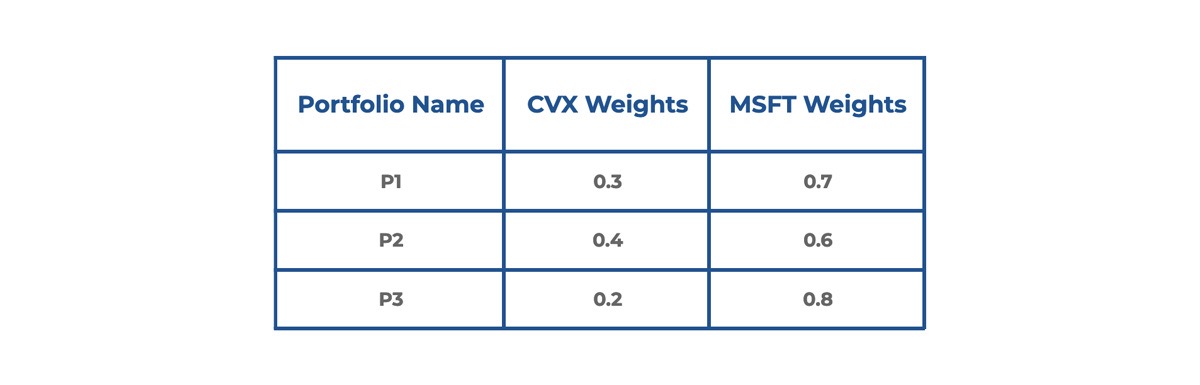
Figure: Stock Weights for Each Portfolio
As you can see, as the weights in a portfolio change the risk and return of that portfolio also changes. Generally, if the returns are higher, the risk will also be higher.
So how do we ascertain the optimal weight? This is where the efficient frontier comes into play.
The Efficient Frontier
To understand the Efficient Frontier, let's take an example.
In the plot below, the x-axis represents portfolio risk (standard deviation) and the y-axis represents portfolio returns. Every possible portfolio combination you can create falls somewhere on this graph. The solid black line that forms the upper boundary of these portfolios is known as the efficient frontier. Portfolios on this line offer the highest expected return for a given level of risk.
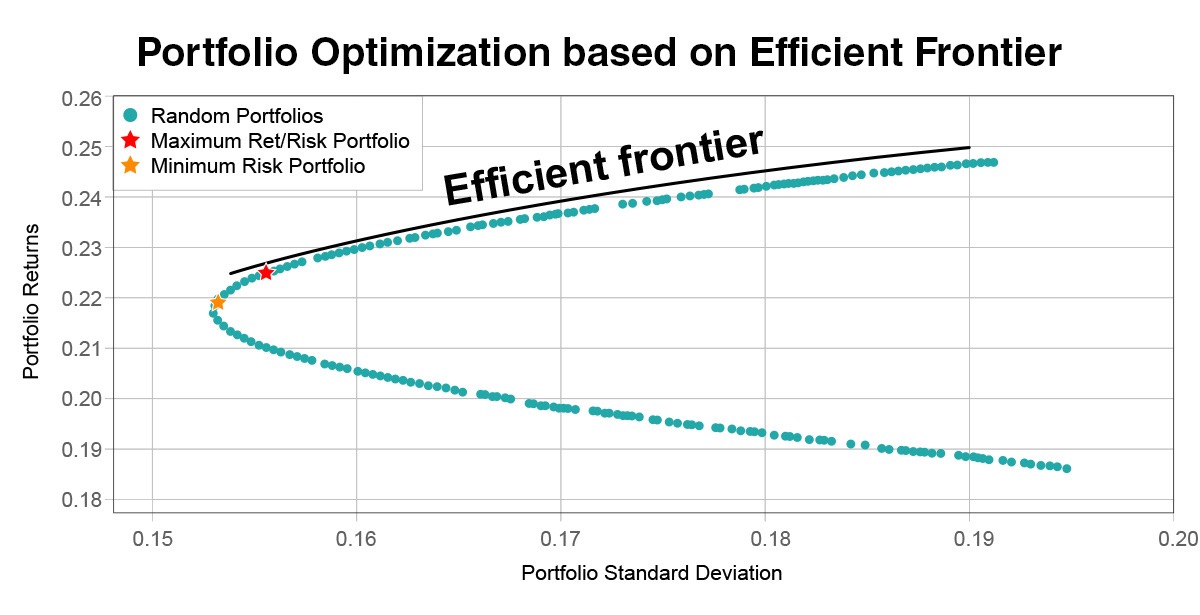
Figure: Portfolio Optimisation based on Efficient Frontier
In the plot above, you can see the portfolio with the lowest risk (marked as a yellow star) also has lower returns as compared to the portfolios lying on the efficient frontier.
So which portfolio is the best? You can select your risk appetite and then choose the portfolio that has better returns. For example, if you have a risk target of 0.16, you can find two portfolios that meet this target. However, only the one on the efficient frontier will give you the maximum returns for that level of risk.
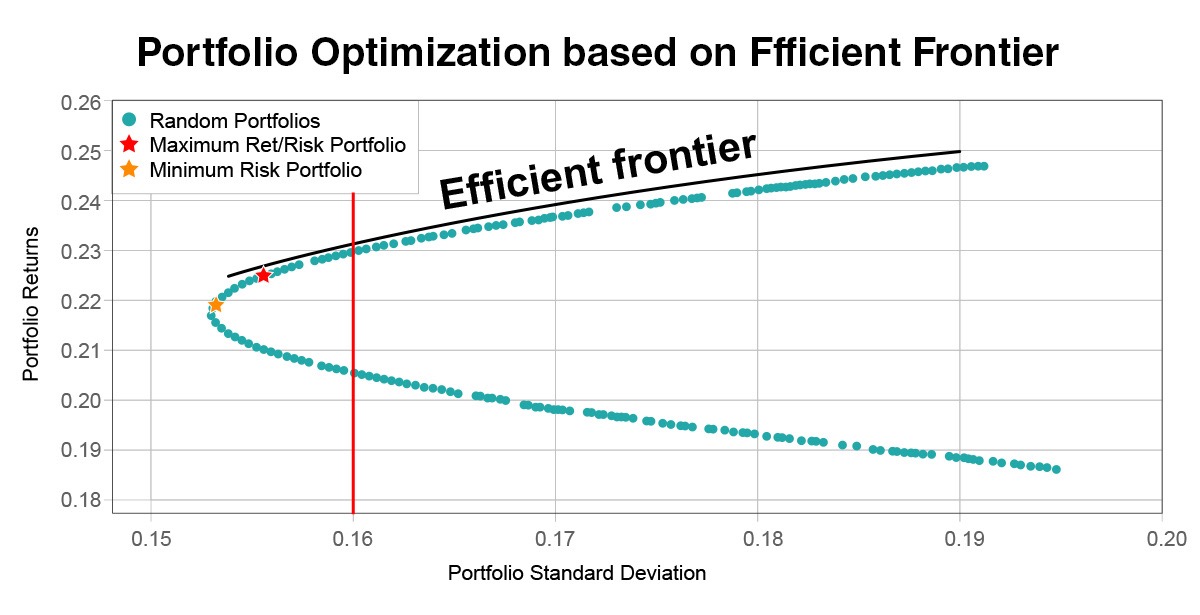
Figure: Optimal Portfolio
The portfolio with the highest return per unit of risk (also known as the Sharpe ratio) is your optimal portfolio. This is marked as a red star on the plot.
Assumptions of MPT
Like any theory, MPT comes with its own set of assumptions and limitations. For one, it assumes that stock returns follow a normal distribution, which isn't always the case in the real world. It also relies on historical data to estimate future risk and returns, but we all know that past performance isn't always indicative of future results. Despite these limitations, MPT provides a valuable framework for thinking about portfolio construction.
Wrapping Up
Now that you have a grasp of the basics of Modern Portfolio Theory, you're ready to take the next step. The Quantitative Portfolio Management course covers how to construct an efficient frontier and calculate the optimal portfolio using Python. Here, we also talk about how you can apply these concepts to a portfolio with multiple stocks. You can refer to Section 3 Unit 7 to get the code for the implementation, all you have to do is take a free preview of this course. You can do this by clicking on the green-coloured Free Preview button on the right corner of the screen next to the FAQs tab and going to Section 3 Unit 7 of the course.

What to do next?
Quantitative Portfolio Management is a beginner level course under Quantra’s Portfolio Management category of courses. If you want to take your learning to the next level, there are a number of courses that you can explore at the intermediate and advanced levels. Ready to begin your guided journey on Portfolio and Risk Management?

IMPORTANT DISCLAIMER: This post is for educational purposes only and is not a solicitation or recommendation to buy or sell any securities. Investing in financial markets involves risks and you should seek the advice of a licensed financial advisor before making any investment decisions. Your investment decisions are solely your responsibility. The information provided is based on publicly available data and our own analysis, and we do not guarantee its accuracy or completeness. By no means is this communication sent as the licensed equity analysts or financial advisors and it should not be construed as professional advice or a recommendation to buy or sell any securities or any other kind of asset.


