How to Backtest Trading Strategies in Pine Script
In this post, you will learn to backtest a trading strategy and implement it live using Pine Script in Tradingview for automated trading.
Before moving forward, it is important to note that backtesting results do not guarantee future performance. Hence, the presented strategy results are intended solely for educational purposes and should not be interpreted as investment advice. A comprehensive evaluation of the strategy across multiple parameters is necessary to assess its effectiveness.
If you’d like to further deepen your understanding and build a full-fledged backtesting framework, check out our dedicated course on Backtesting Trading Strategies


What is Pine Script?
Pine Script is a scripting language unique to TradingView, a widely used web-based platform designed for charting and analysing financial markets. With Pine Script Automated Trading, users can craft personalised technical indicators and trading strategies tailored to their specific needs within the TradingView environment.
Here's an overview of some of the key syntax elements:
Comments:
- Single-line comments start with //.
- Multi-line comments are enclosed in /* ... */.
|
// This is a single-line comment /* This is a multi-line comment */ |
Version Declaration:
- You should specify the Pine Script version using //@version.
|
//@version=4 study("My Script", shorttitle="MS", overlay=true) |
Variables:
- Variables are defined using the var keyword.
- Variables must be declared before they are used.
|
//@version=4 study("My Script", shorttitle="MS", overlay=true) var microsoft_price = 360 var std_dev = 0.10 |
Plotting Data:
- You can plot data on the chart using the plot function.
|
plot(close, title="Close Price", color=color.blue) |
Conditional Statements:
- Pine Script supports if statements for conditional execution.
|
//@version=4 isBullish = close > open if (isBullish) plotarrowup("Bullish", colorup=color.green) else plotarrowdown("Bearish", colordown=color.red) |
This Pine Script code uses plotarrowup to display a green upward arrow labelled "Bullish" when the closing price is higher than the opening price, indicating a bullish condition. Similarly, it employs plotarrowdown to show a red downward arrow labelled "Bearish" when the closing price is lower than the opening price, signifying a bearish condition. This helps traders quickly visualise market sentiment on a price chart.
Functions:
- Pine Script includes built-in functions for technical analysis (e.g., sma, ema, rsi, etc.).
- You can also create custom functions.
|
//@version=4 study("Custom Function Example", shorttitle="CFE", overlay=true) // Define function to calculate moving average myCustomFunction(src, length) => sma(src, length) // Calculate moving average sma_14 = myCustomFunction(close, 14) plot(sma_14, title="SMA 14", color=color.blue) |
This Pine Script code defines a custom function named myCustomFunction, which calculates the simple moving average (SMA) of a given data source (src) over a specified period (length). Then, it uses the plot function to display the SMA with a period of 14 as a blue line on the chart.
Operators:
- Pine Script supports arithmetic, comparison, and logical operators like +, -, *, /, <, >, ==, !=, and, or, etc.
Alerts:
-
You can create alerts using the alertcondition function.
|
//@version=4 study("Alert Example", shorttitle="Alerts", overlay=true) upTrend = close > sma(close, 50) alertcondition(upTrend, title="Up Trend Alert", message="The market is in an uptrend!") |
In this example, we use alertcondition to create an alert when the upTrend condition is met, and it will trigger a message when the market is in an uptrend. You can then make a trading decision accordingly
Input Variables:
- You can create input variables to make your script more customisable.
|
//@version=4 study(title="Simple Moving Average", shorttitle="SMA", overlay=true) length = input(14, title="SMA Length") sma_value = sma(close, length) plot(sma_value, title="SMA", color=color.blue) |
This Pine Script code allows for a customisable Simple Moving Average (SMA) study. Users can adjust the SMA period length using the "length" input variable, which influences the SMA calculation. The script then plots the SMA on the price chart with a blue colour. This flexibility makes it easy for traders to adapt the SMA to their preferred settings and trading strategies.
This is just a basic overview of Pine Script syntax. Pine Script can become quite complex when implementing advanced strategies and indicators. TradingView's Pine Script documentation for automated trading is an excellent resource to learn more and explore the full capabilities of the language.
Backtesting Trading Strategies with Pine Script in TradingView
Now that you have a basic understanding of the syntax of Pine Script, let’s explore how to backtest a trading strategy in Pine Script.
Strategy Overview:
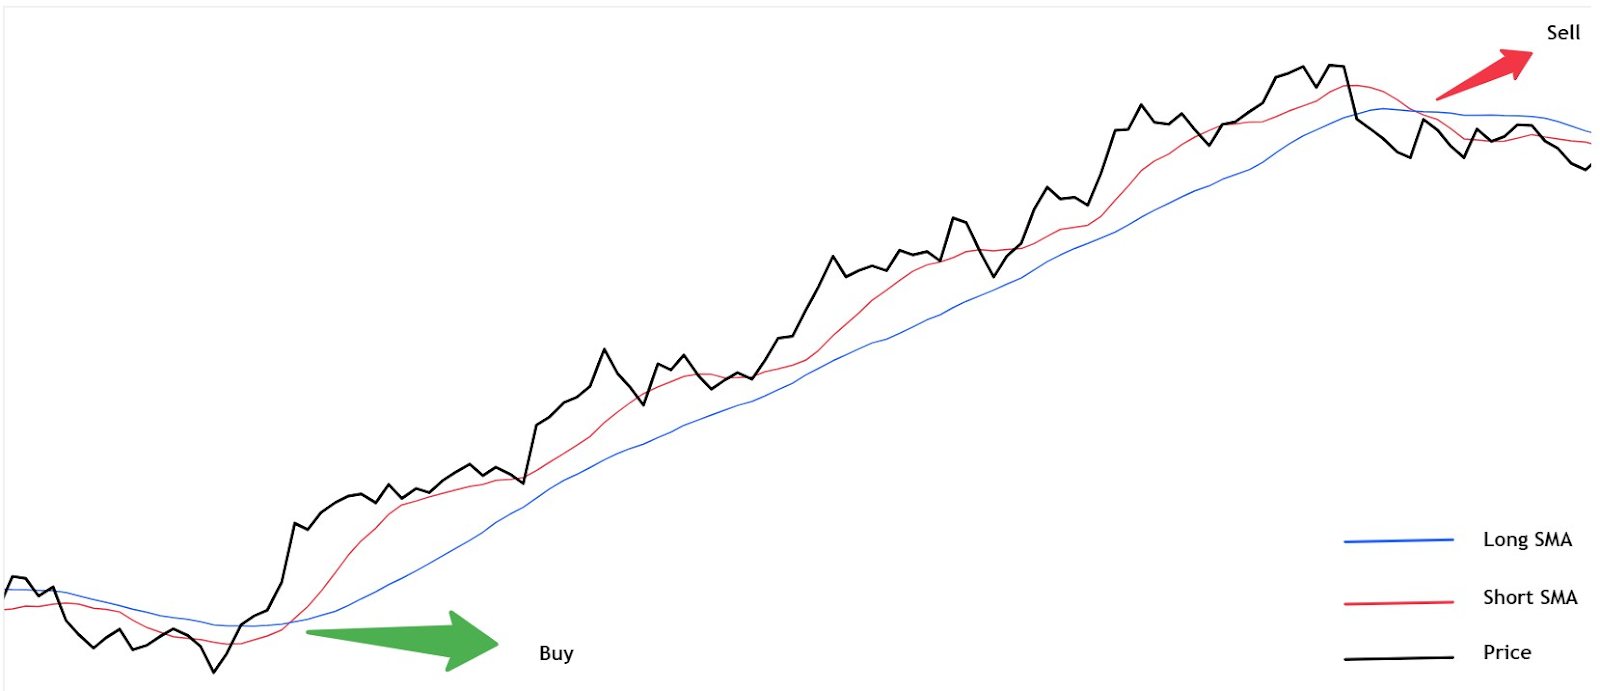
Our strategy is based on a simple moving average (SMA) crossover. It involves two SMAs: a shorter one and a longer one. When the shorter SMA crosses above the longer SMA, it generates a buy signal, and when it crosses below, it generates a sell signal.
Pine Script Implementation:
Let's implement this strategy in Pine Script. We'll use a 100-period SMA as the long SMA and a 50-period SMA as the short SMA.
Here's the code:
|
//@version=4 strategy("SMA Crossover Strategy", overlay=true) // Define input variables fast_length = input(50, title="Fast SMA Length") slow_length = input(100, title="Slow SMA Length") // Calculate fast and slow SMAs fast_sma = sma(close, fast_length) slow_sma = sma(close, slow_length) // Plot fast and slow SMAs on the chart plot(fast_sma, title="Fast SMA", color=color.blue) plot(slow_sma, title="Slow SMA", color=color.red) // Define long and short conditions based on SMA crossovers long_condition = crossover(fast_sma, slow_sma) short_condition = crossunder(fast_sma, slow_sma) // Create strategy entries for long and short positions strategy.entry("Long", strategy.long, when=long_condition) strategy.entry("Short", strategy.short, when=short_condition) |
This Pine Script code implements a Simple Moving Average (SMA) crossover strategy.
- It uses the input function to customise SMA lengths, calculates the fast and slow SMAs with the sma method, and plots them on the chart.
- The strategy's long and short conditions are determined using crossover and crossunder methods based on the relationship between the fast and slow SMAs.
- It then enters long or short positions using the strategy.entry function when the conditions are met, overlaying the strategy on the price chart.
Backtesting in TradingView
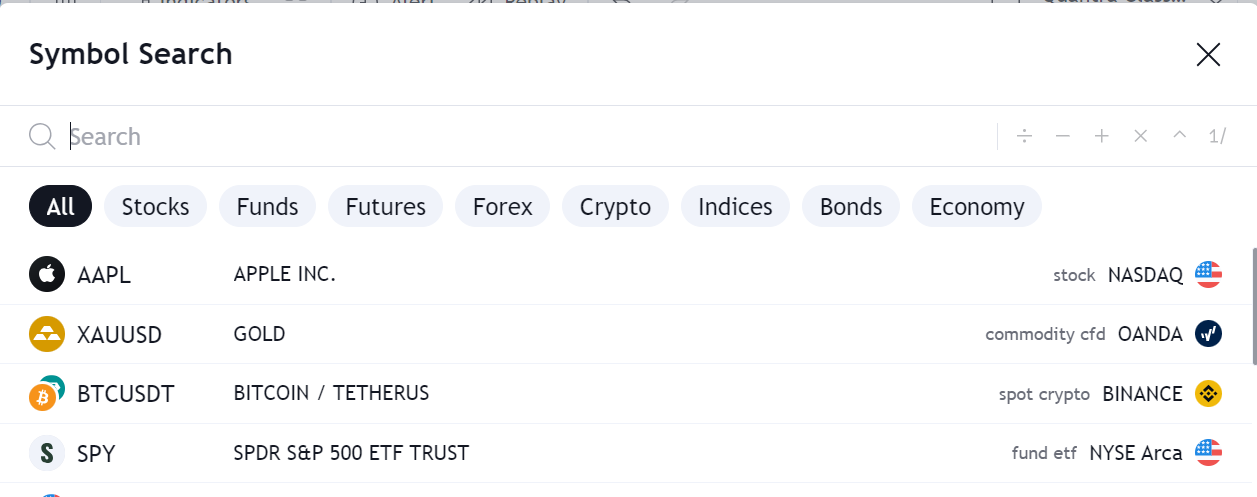
- Log in to your TradingView account and navigate to a symbol you want to test the strategy on.
- Click on “Pine Editor” at the left bottom of the screen and enter the Pine Script code.
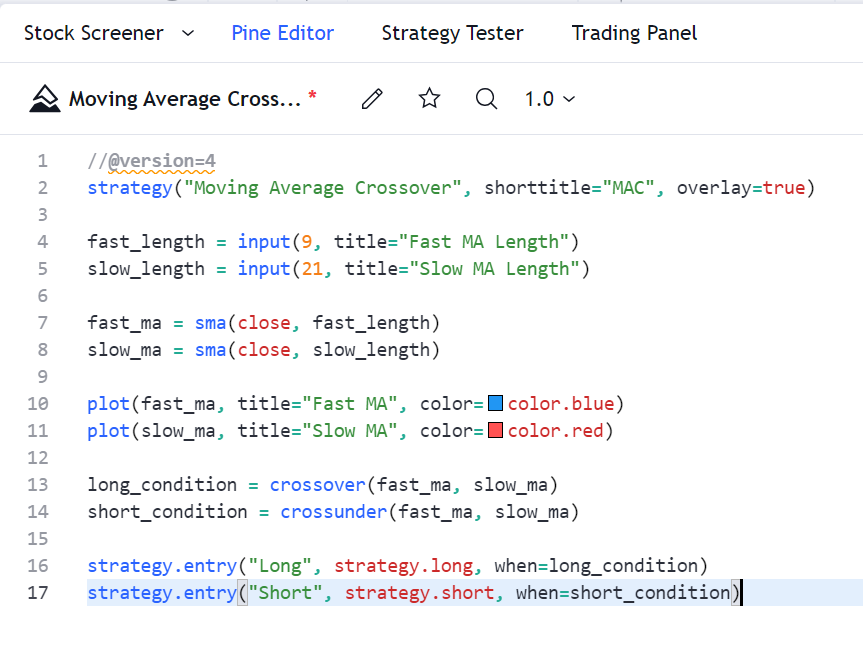
It’s a good practice to name the script. Let’s name this script as my_script.
- Click on the "Indicators" tab on the top bar and add the strategy you created by searching for its name.
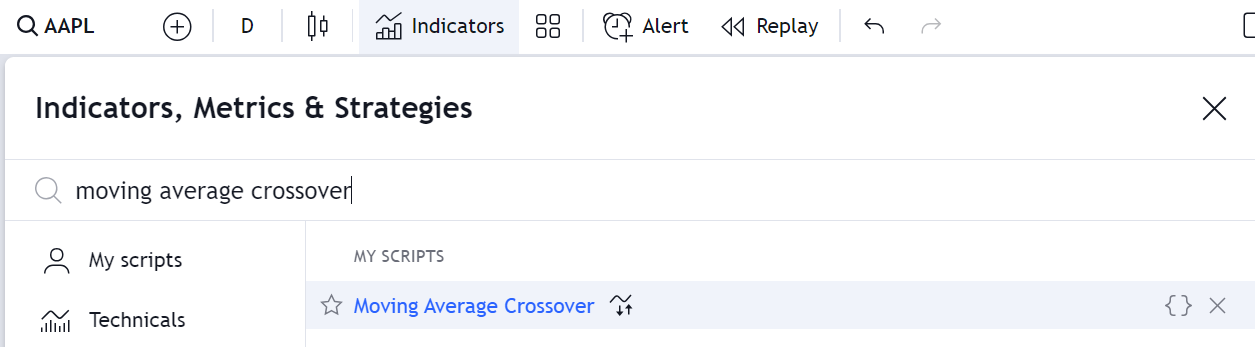
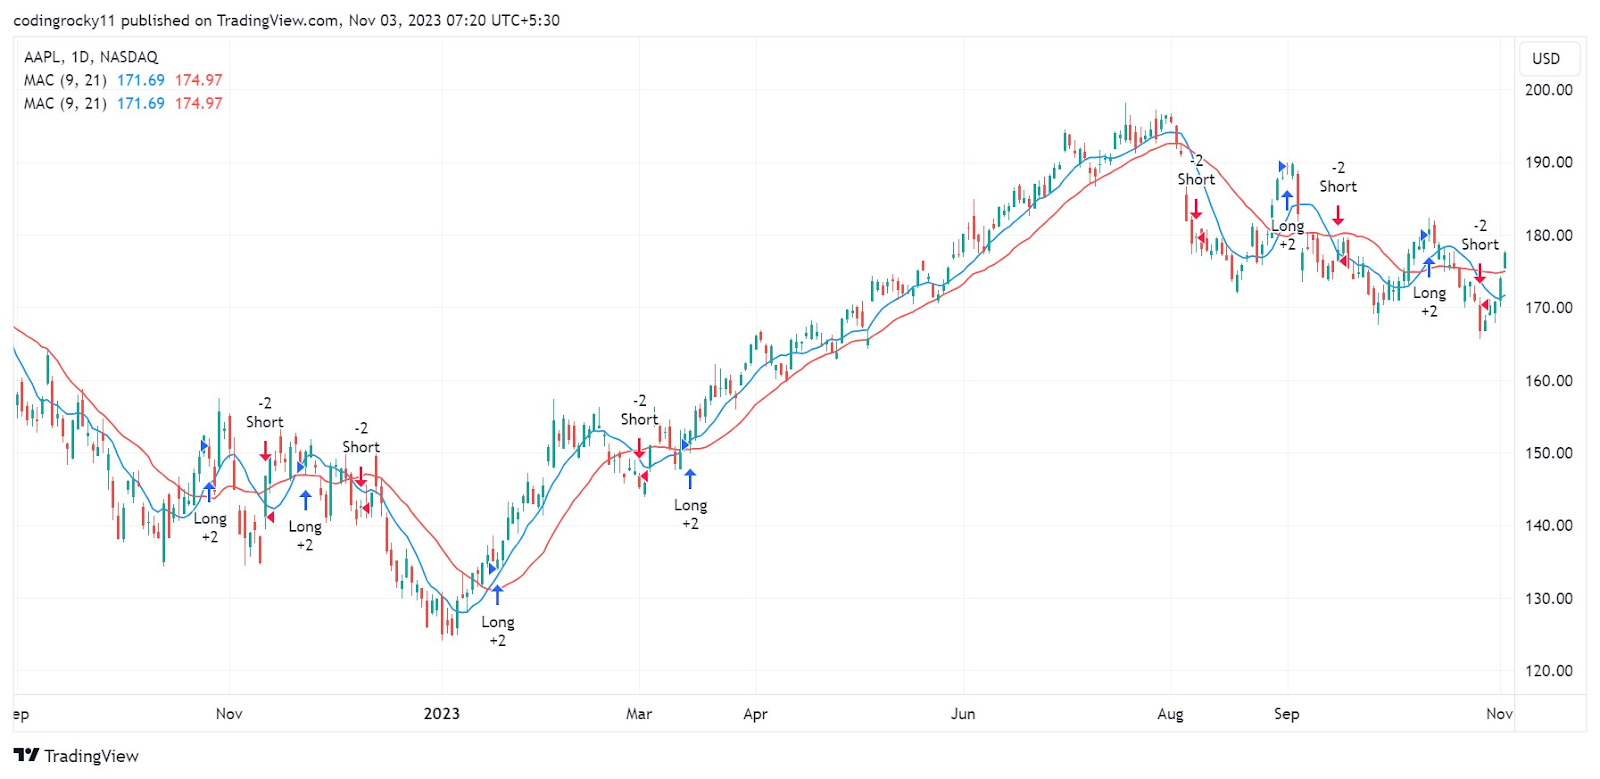
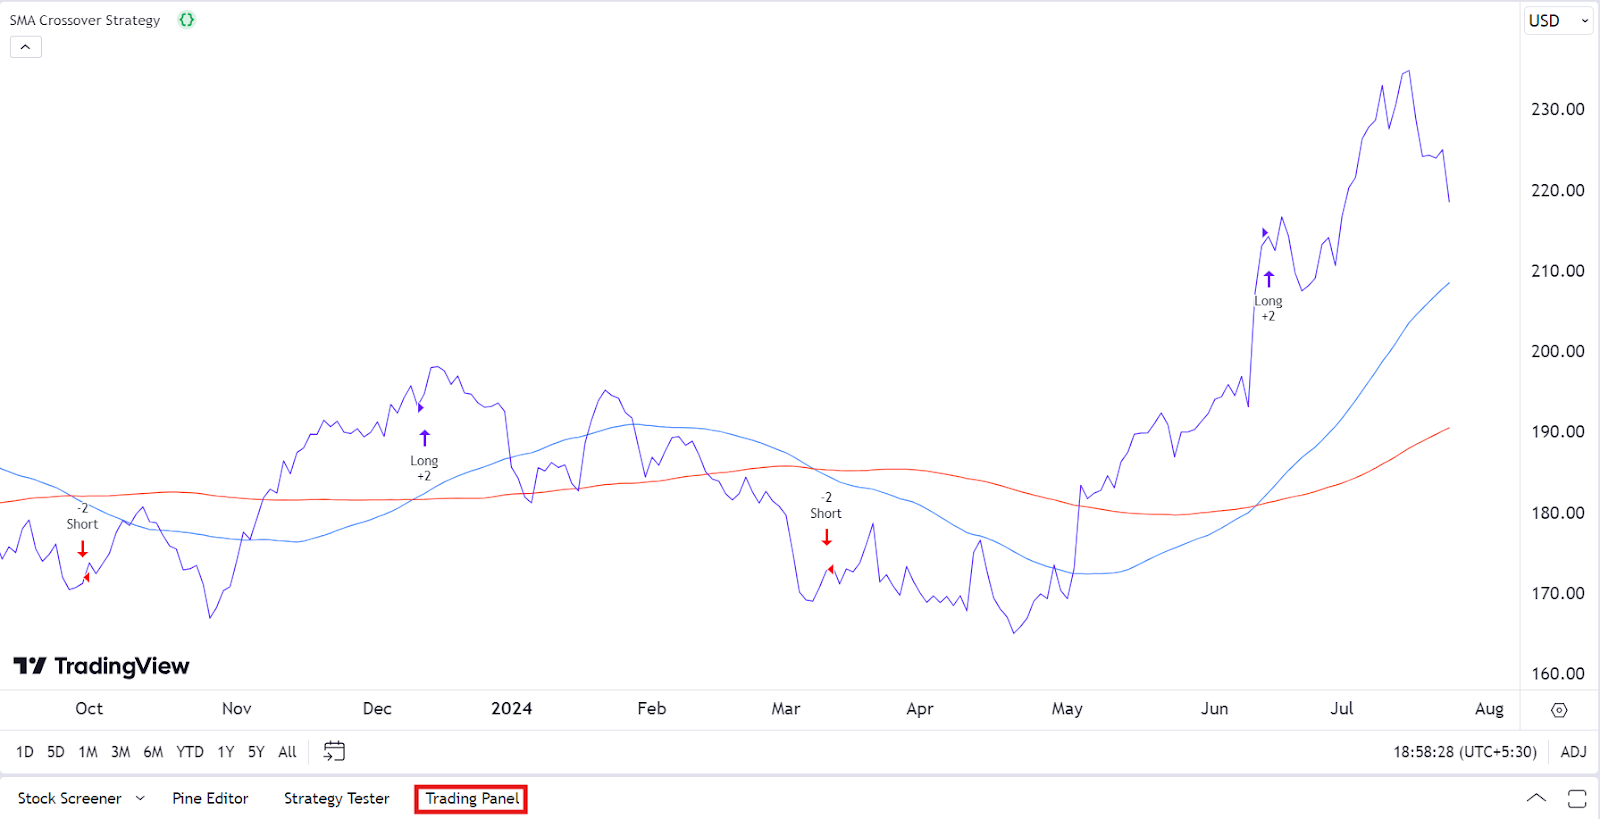
This would apply the strategy to the contract selected and you will see the short and long positions marked on the chart as per the strategy.
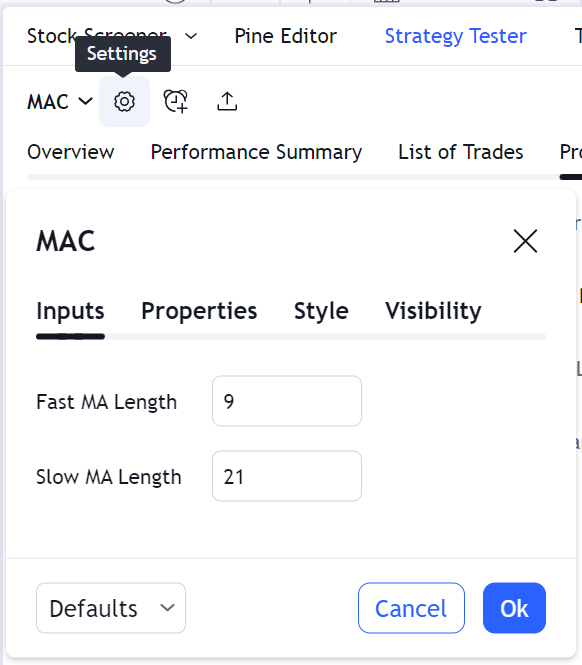
- Click on “Strategy Tester” at the bottom right and click on the “Settings” button to configure the strategy.
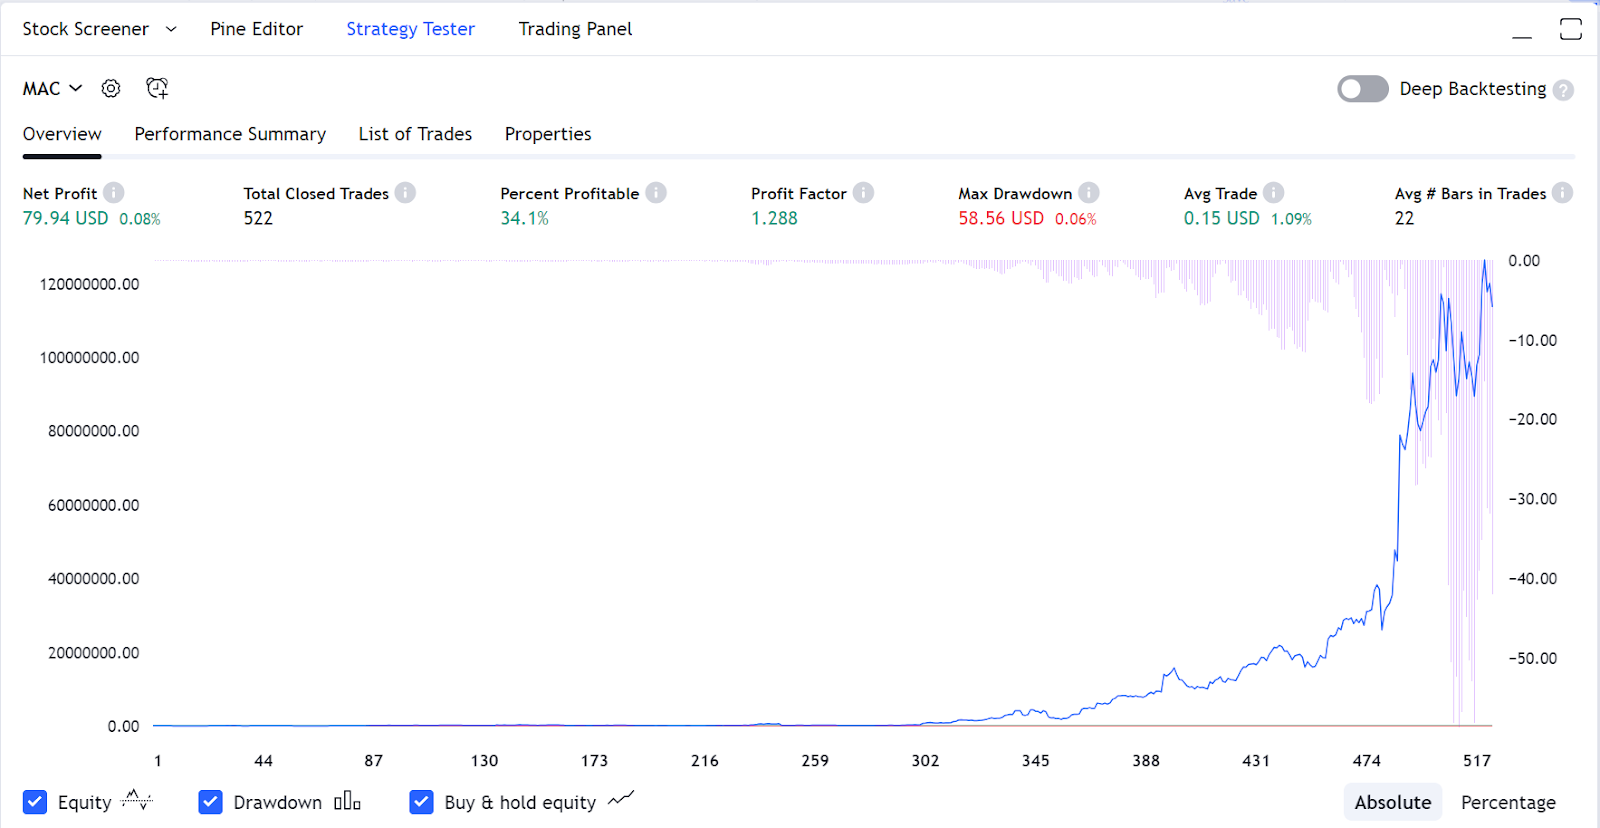
- To visit the backtest results, click on the “Overview” tab to get the overview of the backtest such as performance plot, Net Profit, Total Closed Trades, and other performance metrics.
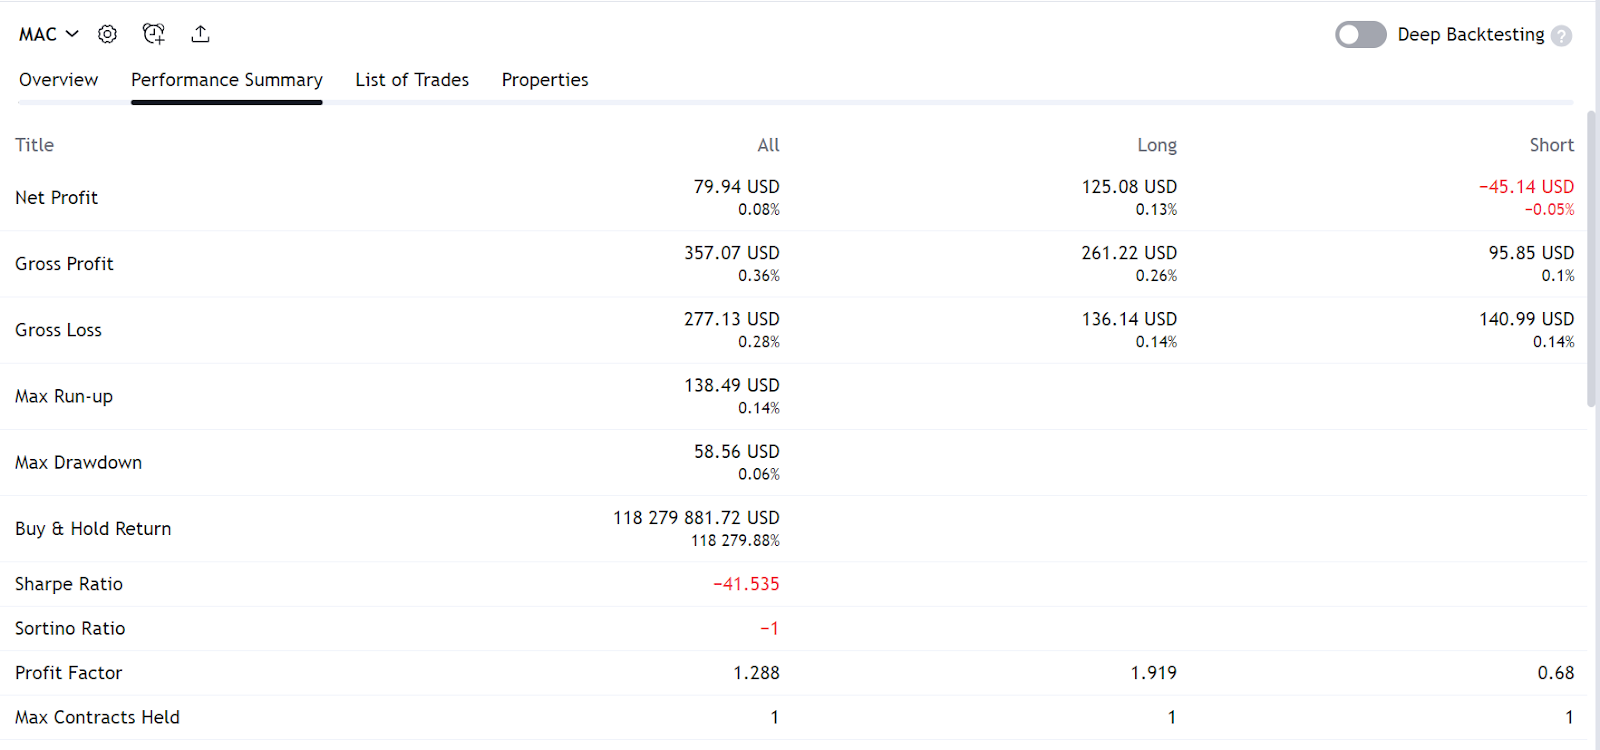
- To get a complete performance summary of the strategy backtest, click on the “Performance Summary” tab.
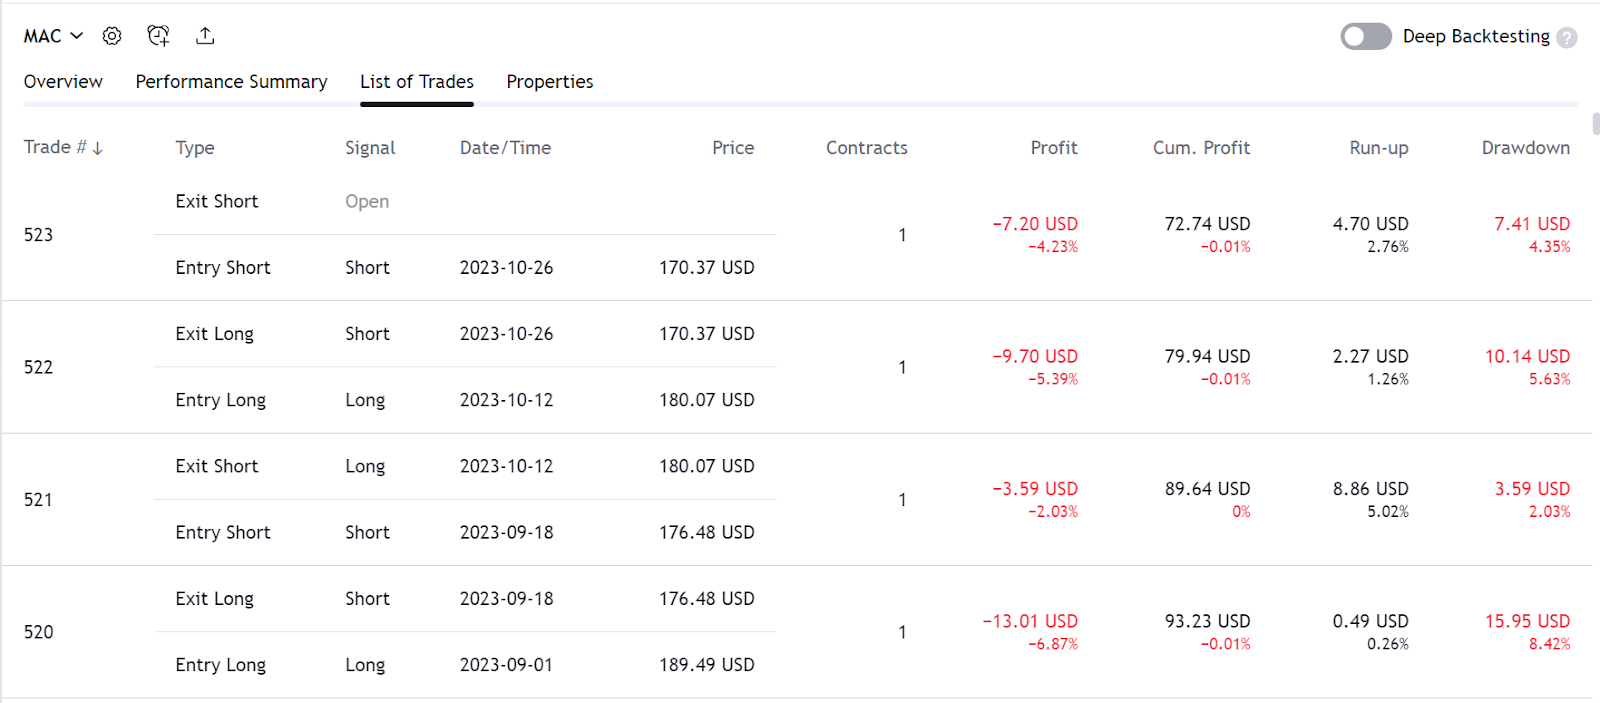
- Click on the tab “List of Trades” to get trade-wise details of all the trades taken during the backtest.
Remember that this is a basic example. Pine Script offers more advanced features for creating complex trading strategies, including risk management, multiple conditions, and custom indicators. It is important to note that backtesting results do not guarantee future performance. The presented strategy results are intended solely for educational purposes and should not be interpreted as investment advice. A comprehensive evaluation of the strategy across multiple parameters is necessary to assess its effectiveness.

Taking the Strategy Live
Step 1: Connect TradingView to a Broker
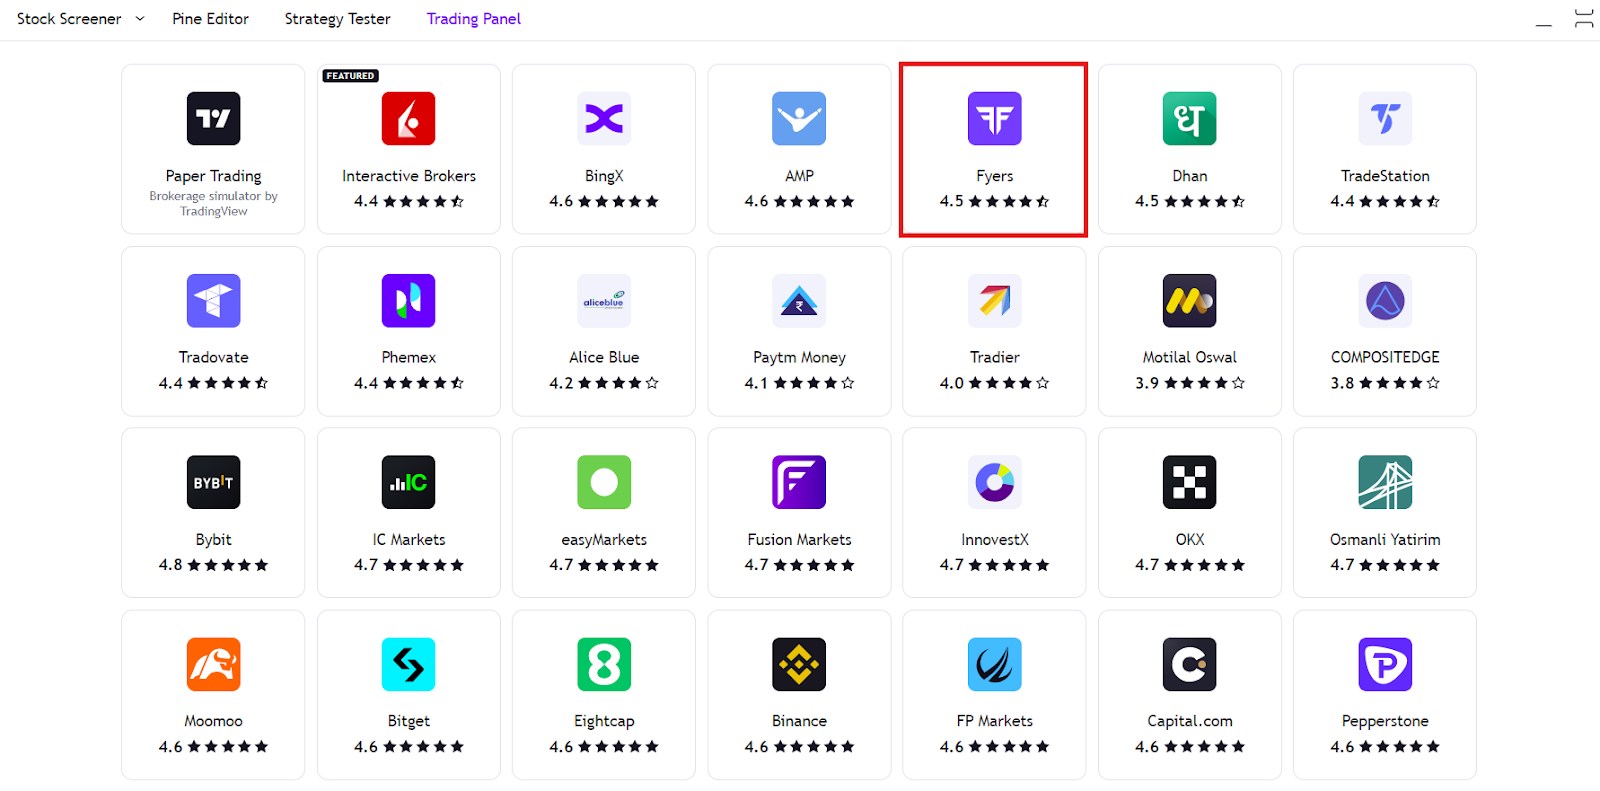
- Click on ‘Trading Panel’ at the bottom of the screen.
- Select the broker from the list of brokers presented in the trading panel.
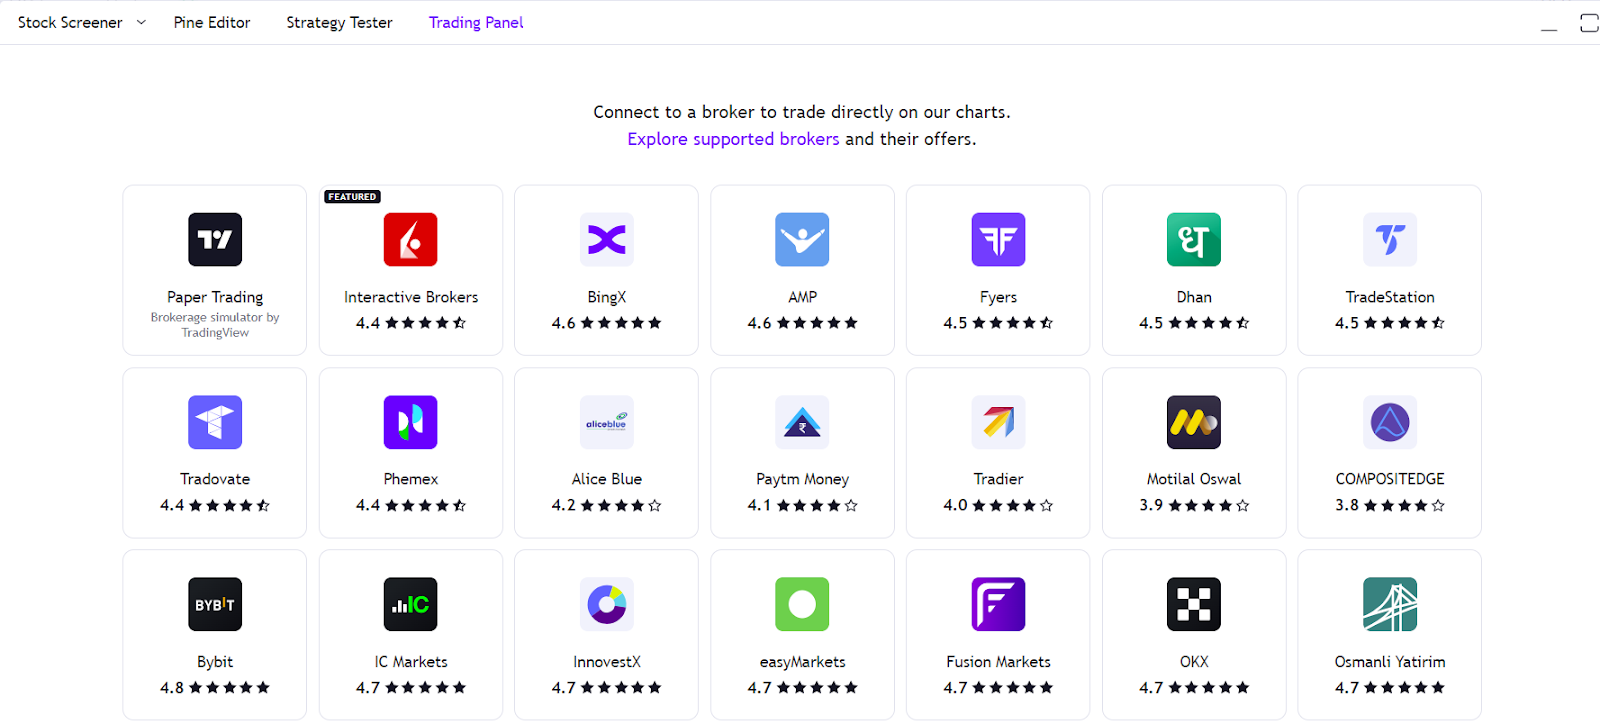
If you wish to explore more brokers, follow the link: Explore supported brokers
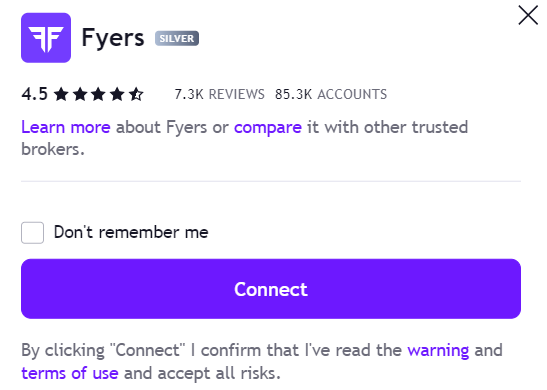
- For example, let’s select Fyers. Click on the broker selected, and click ‘Connect’ on the pop up
- This will redirect you to the log in page of the broker. Follow the on-screen instructions to log in and authorise the connection.
Step 2: Convert Your Strategy to a Trading Bot
TradingView strategies need to be converted into alerts to automate trades. These alerts can then be connected to your broker using a bridge service or API.
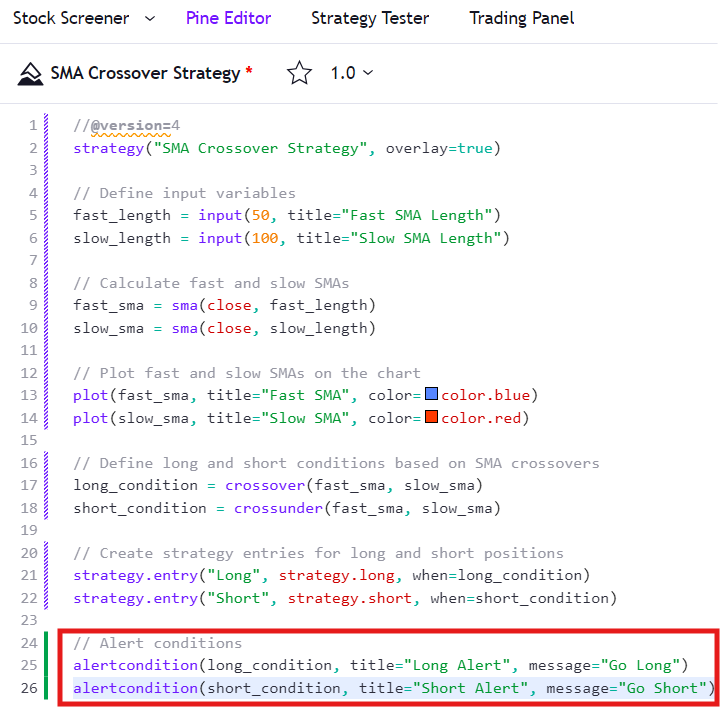
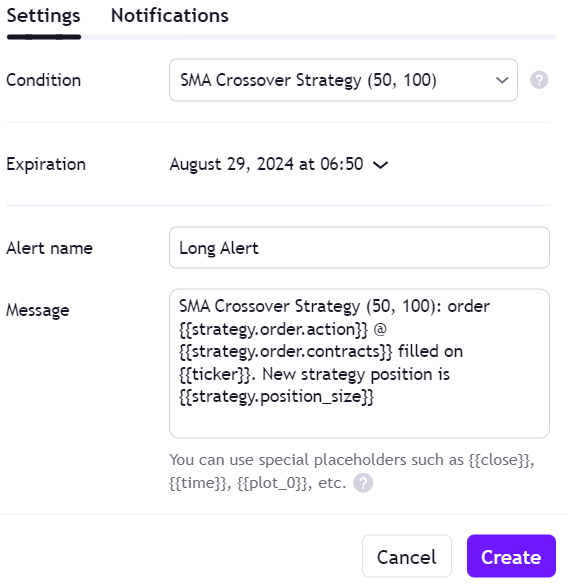
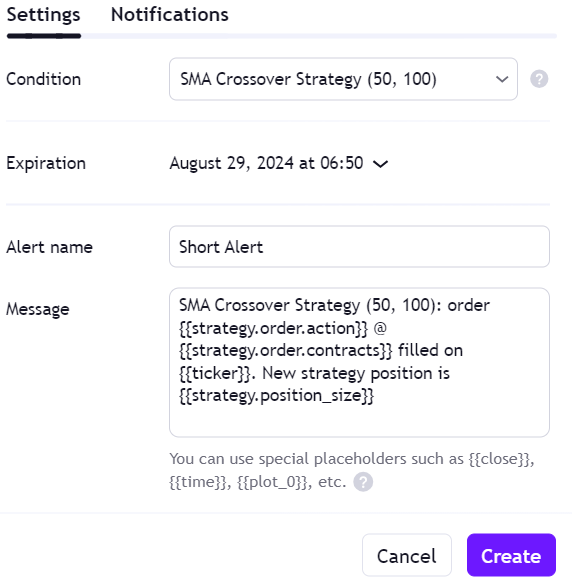
Create Alerts for Strategy Signals:
- Add alert conditions for your strategy entries. Use the alertcondition function in Pine Script to define the alerts. Update your Pine Script to include alert conditions:
Set Up Alerts in TradingView:
- Click the "Alerts" button (clock icon) at the top of the TradingView chart.
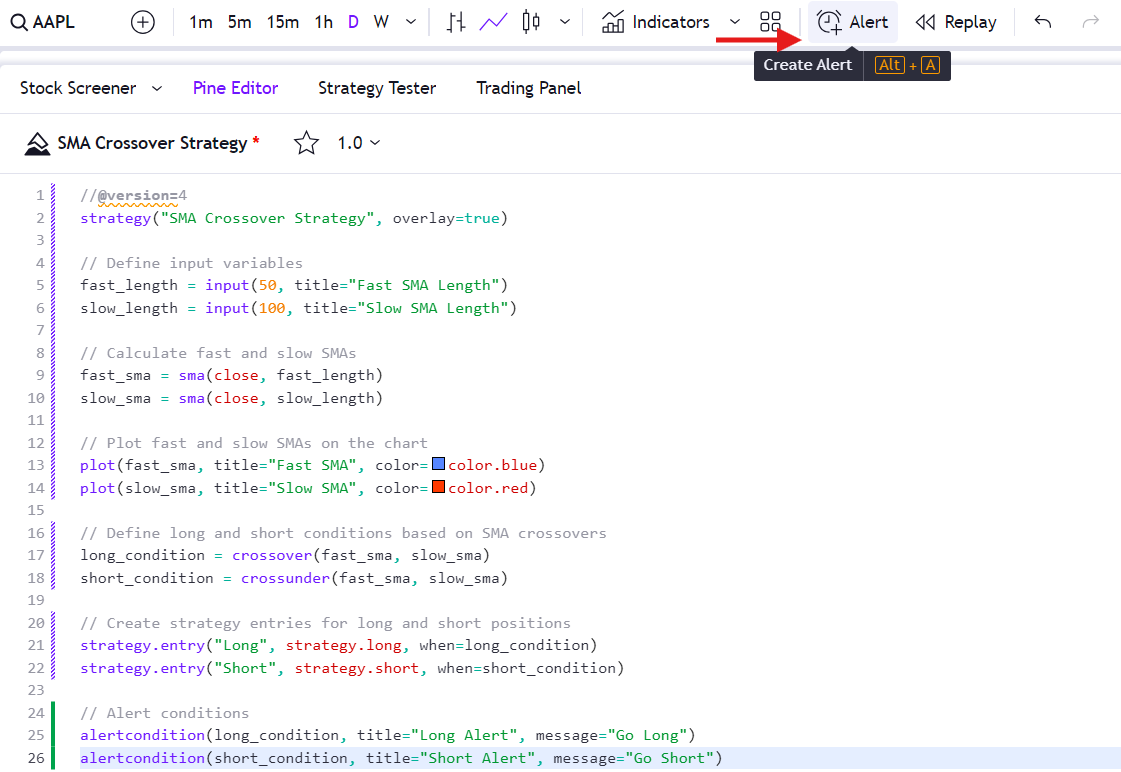
- Set up alerts for the "Long Alert" and "Short Alert" conditions you created.
Step 3: Automate the Trading Alerts
- Use a Bridge Service: Services like algotradingbridge, AutoView, or other webhook-based services can bridge TradingView alerts to your broker's API.
- Set Up Webhook URLs: Configure the webhook URL provided by the bridge service in your TradingView alert settings.
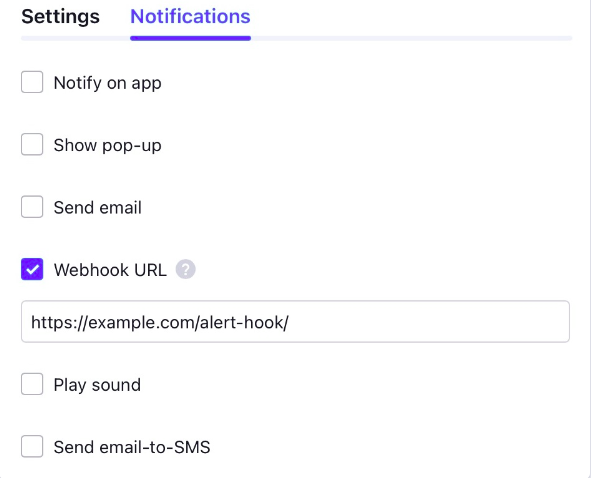
Example Using a Webhook URL
- Configure Alerts with Webhook: When setting up the alert, input the webhook URL provided by the bridge service.
- Bridge Service Setup: Configure the bridge service to listen for TradingView alerts and execute trades via your broker’s API.
Example Workflow:
- TradingView Alert: TradingView detects a crossover and triggers an alert.
- Webhook Notification: The alert is sent to the webhook URL.
- Bridge Service: The bridge service receives the alert and sends an order to the broker via their API.
- Broker Execution: The broker executes the trade according to the received order.
This general workflow should help you automate your Pine Script strategy and take it live using a broker connected to TradingView. Ensure you thoroughly test your setup with paper trading or a demo account to confirm everything works correctly before going live with real funds.
With Automated Trading with TradingView, traders can implement and execute their strategies, reducing the need for constant manual monitoring and intervention.
What to do next?
- Learn to build a full-fledged backtesting framework with this course
- Click on "Free Preview"
- Go through 10-15% of course content
- Drop us your comments and queries on the community
IMPORTANT DISCLAIMER: This post is for educational purposes only and is not a solicitation or recommendation to buy or sell any securities. Investing in financial markets involves risks and you should seek the advice of a licensed financial advisor before making any investment decisions. Your investment decisions are solely your responsibility. The information provided is based on publicly available data and our own analysis, and we do not guarantee its accuracy or completeness. By no means is this communication sent as the licensed equity analysts or financial advisors and it should not be construed as professional advice or a recommendation to buy or sell any securities or any other kind of asset.


