How to Apply Neural Networks for Trading?
Traders use many techniques to forecast what could happen the next trading day in the market in order to make trading decisions. Among these, neural networks, long favoured by quants, stand out. These advanced systems, rooted in artificial intelligence, play a pivotal role in shaping modern trading strategies.
In this post, we will discuss what neural networks are and how to use them for trading with an example of a strategy.

All the concepts covered in this post are taken from the Quantra course Neural Networks in Trading. You can preview the concepts taught in this post by clicking on the free preview button and going to Section 1 of the course.
Note: The links in this tutorial will be accessible only after logging into quantra.quantinsti.com.

Note that backtesting results do not guarantee future performance. The presented strategy results are intended solely for educational purposes and should not be interpreted as investment advice.
In this post, we will cover the following topics:
- What is a Neural Network
- Structure of a Neural Network
- Applications of Neural Networks in Trading
- Trading Strategy Using the Neural Network
If you are new to machine learning, the Introduction to Machine Learning for Trading course would be helpful.
What is a Neural Network?
A neural network is a computational model designed to mimic the way biological neural networks in the human brain process information. It is made up of interconnected units known as neurons or nodes, which collaborate to tackle complex problems. Neural networks are essential in artificial intelligence and machine learning, and they find application in a wide range of fields.
In trading, neural networks can be utilised for both regression and classification tasks. For example, a Multilayer Perceptron (MLP) networkFor example, a Multilayer Perceptron Classifier, which is a type of neural network can be used both for regression (MLP rRegressor) and classification (MLP cClassifier).
Structure of a Neural Network
Before we dive into the structure of neural networks, let’s understand what a neuron is. Consider a scenario where you want to predict one-day returns of an asset using the five-day returns. You can use a linear regression equation.

Figure: Linear Regression To Predict One-Day Future Returns
In the equation,
- ? is the one-day future returns
- W is the weight (or coefficient)
- X is the five-day returns and B is the bias (or intercept).
So, a linear regression equation is used to predict an output using an input.
This is what happens in a neuron. A neuron would take an input, pass it to an equation and return an output.

The structure of a neural network consists of interconnected layers of neurons. Each layer serves a specific purpose in processing input data and generating output. The following is the typical structure of an MLP classifier neural network.
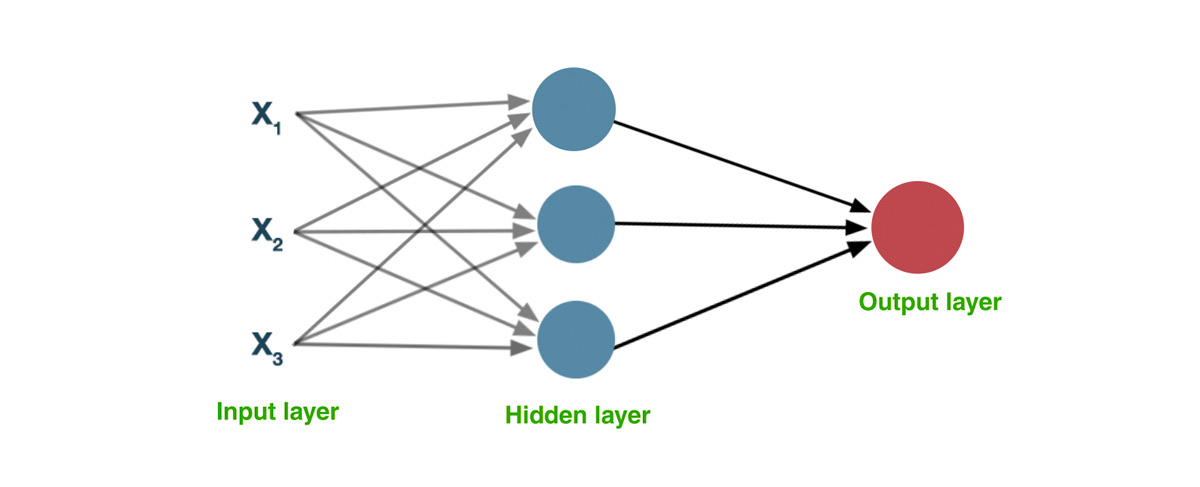
A neural network typically takes features as inputs and figures out the appropriate function (equation) for each neuron in the network to improve the prediction accuracy.
To know more about the structure of a neural network with an example, watch the video in section 1 unit 3 of the course ‘Neural Networks in Trading’.

Applications of Neural Networks in Trading
Neural networks are used to analyse historical and real-time market data to predict future price movements and identify trading opportunities. By training models like Multilayer Perceptrons (MLPs), Convolutional Neural Networks (CNNs), and Recurrent Neural Networks (RNNs) on market indicators such as price and volume, these networks learn patterns and relationships. Once trained, the neural network generates buy or sell signals that can be traded.
Trading Strategy Using the Neural Network
Let’s create an MLPClassifier neural network to predict whether the returns of the next trading day will be positive or not. If neural networks classify the next day's returns as positive, we will take a long position and hold the position till the neural network classifies the next trading day as a non-positive returns day.
The following is the structure of the MLP classifier neural network.
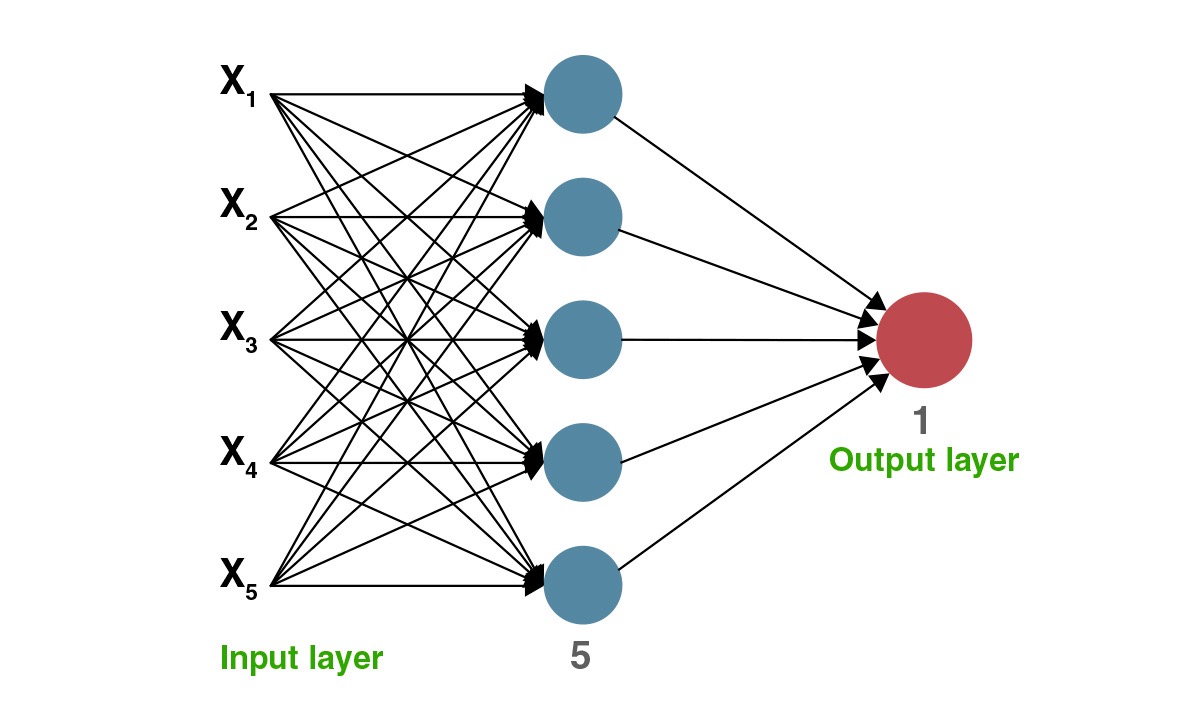
As you can see, the input layer has 5 input features, and the hidden layer has 5 neurons.
Here are the steps involved in creating an MLP classifier to predict whether ‘AAPL’ will have positive returns or not on the next trading day. Based on this prediction, we will backtest AAPL and analyse the strategy’s performance.
Step 1: Define predictor variables and a target variable
Step 2: Prepare the datasets
Step 3: Create and train the neural network
Step 4: Trade based on predictions of the neural network
Step 1: Define predictor variables and a target variable
The predictor variables are the input features to the neural network that predict the target variable.
We can use features such as past returns, volume information, standard deviation of returns etc. as the predictor variables. In this example, we are using the following 5 features as the input to the neural network.
- Previous day returns
- Rolling 5-day returns
- Relative volume (i.e. volume/20-day average volume)
- High-Low
- Open-Close
Since we want to categorise the movement of the next trading day as positive and non-positive, let’s label the target variable as ‘1’ and ‘0’. ‘1’ indicates positive returns on the next trading day whereas ‘0’ indicates negative returns or no change in the price.
Step 2: Prepare the datasets
The neural network should be trained on the training data so that it will learn the relationship between the input features and the target variable. After training, the testing data is passed as an input to the neural network for generating predictions.
So, use the first 80% of the data as training data and the rest 20% of the data as testing data.
In this example, let’s train the neural network on AAPL data from Jan of 2018 till mid-March 2023 and test the network using the data from mid-March 2023 to June of 2024.
Post the data split, scale the datasets using the standard scaler. The standard scaler standardises the datasets by removing the mean and scaling to unit variance.
Step 3: Create and train the neural network
Create an MLP classifier neural network with 5 inputs in the input layer, 5 neurons in the hidden layer and 1 neuron in the output layer for the target variable.
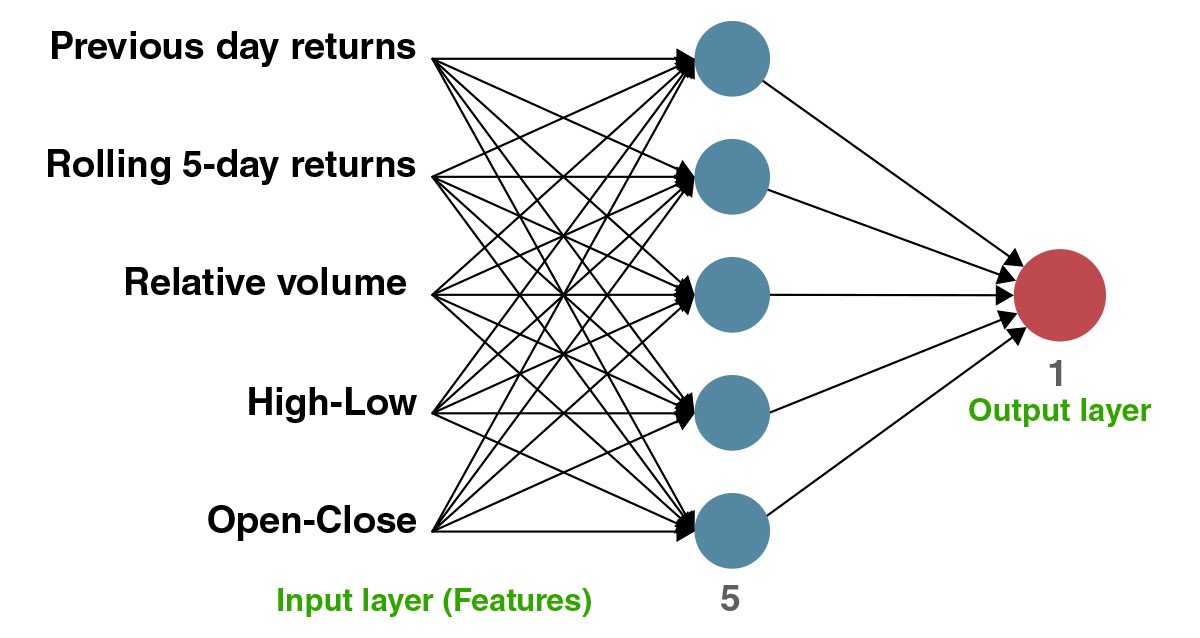
Figure: MLP Classifier to Classify One-Day Future Returns Using 5 Features
This network is trained using the training dataset and then testing data is passed into the neural network to generate the predictions.
Based on the predictions, the entry and exit rules of the strategy are created.
- Enter a long position when the neural network predicted ‘1’
- Exit the long position when the neural network predicted ‘0’
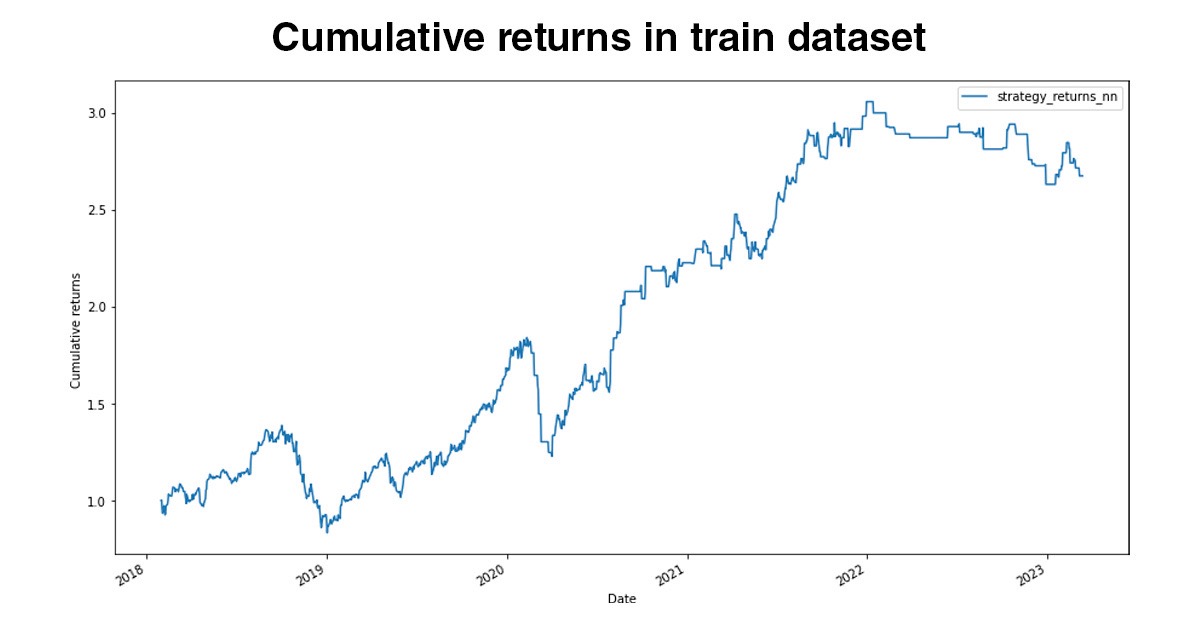
To understand how the neural network performed on the training data, we can perform predictions on the training data.
Based on these trading rules, the cumulative returns of the strategy on AAPL in the training period was 2.67 (indicates that the investment has increased in value by 167%).
On the other hand, the cumulative returns during the testing period is 1.27%. (indicates that the investment has increased in value by 27%).
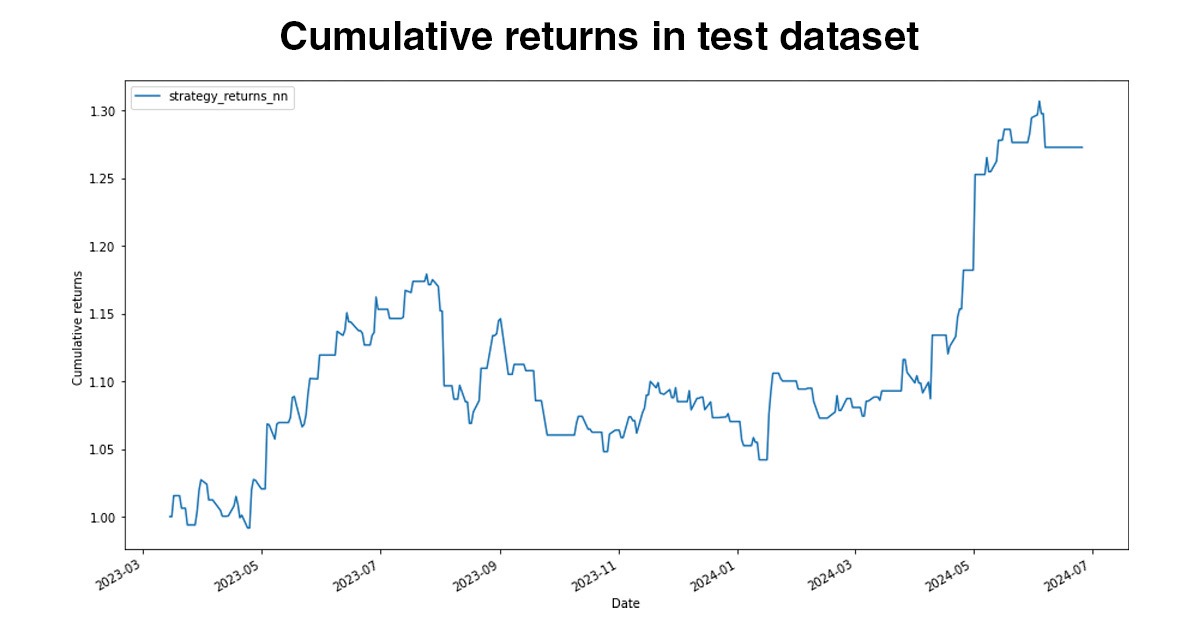
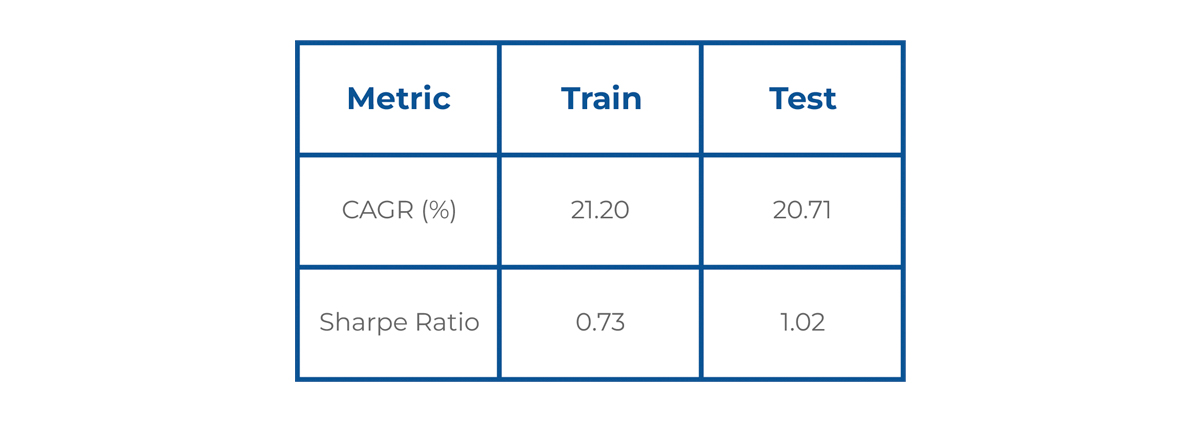
The strategy has a similar CAGR on training and testing data. However, the Sharpe ratio has improved in the test period.
The strategy discussed above has been covered in detail along with the Python code in this unit of the Neural Networks in Trading course. You need to take a Free Preview of the course by clicking on the green-coloured Free Preview button on the right corner of the screen next to the FAQs tab and go to Section 1 and Unit 21 of the course.

What to do next?
- Go to this course
- Click on
- Go through 10-15% of course content
- Drop us your comments and queries on the community

About the Course Author
Dr Ernest Chan is the Managing Member of QTS Capital Management, LLC, a commodity pool operator and trading advisor. QTS manages a hedge fund as well as individual accounts. He has worked in the IBM human language technologies group, where he developed a natural language processing system that ranked 7th globally in the defence advanced research project competition. He has also worked with Morgan Stanley's artificial intelligence and data mining group where he developed trading strategies.
You can view the courses by Dr Ernest Chan here.
IMPORTANT DISCLAIMER: This post is for educational purposes only and is not a solicitation or recommendation to buy or sell any securities. Investing in financial markets involves risks and you should seek the advice of a licensed financial advisor before making any investment decisions. Your investment decisions are solely your responsibility. The information provided is based on publicly available data and our own analysis, and we do not guarantee its accuracy or completeness. By no means is this communication sent as the licensed equity analysts or financial advisors and it should not be construed as professional advice or a recommendation to buy or sell any securities or any other kind of asset.


