How Many Clusters Should There Be in K-Means?
Unsupervised learning models have been a boon for ML practitioners who seemed to struggle to fit their problem statement into the supervised learning model framework. And one of the famous ones is K-means clustering model.
It’s almost magical to think that an ML model can cluster data based on certain common characteristics, and K-means does just that.
It is a neat little machine learning model but how do you know that 3, or 4, is the ideal number for the number of clusters in the K-Means model?
Well, let’s read on to find out.
All the concepts covered in this post are taken from section 8 unit 1 of the Quantra course on Unsupervised Learning in Trading. You can preview the concepts taught in this course by clicking on the free preview button.
Note: The links in this tutorial will be accessible only after logging into quantra.quantinsti.com and enrolling for the free preview of the course.

Let’s start with the basics first.
What is the objective of K-means?
Imagine you have a bunch of toys scattered on the floor, and you want to organise them into groups based on their similarities. The objective of K-means is kind of like finding the best way to group these toys.
- Pick the Number of Groups (K): First, you decide how many groups you want to create. Let's say you want to make three groups.
- Find the Centres: Next, imagine drawing circles around some toys in a way that each circle includes toys that are close to each other. These circles are like the centres of your groups.
- Assign Toys to the Nearest Centre: Now, for each toy, you look at which circle (centre) it is closest to. You put the toy in that group.
- Move the Centers: After putting the toys in groups, you look at where the centres are. You move the circles (centres) so that they are now at the average position of all the toys in their group.
- Repeat Until Happy: You keep doing steps 3 and 4 until the circles (centres) don't move much anymore. At this point, each group has toys that are close to each other, and you're done!
How do you measure the distance between the centres and the toy?
Euclidean distance to the rescue!
The Euclidean distance between two points is represented by the following formula:
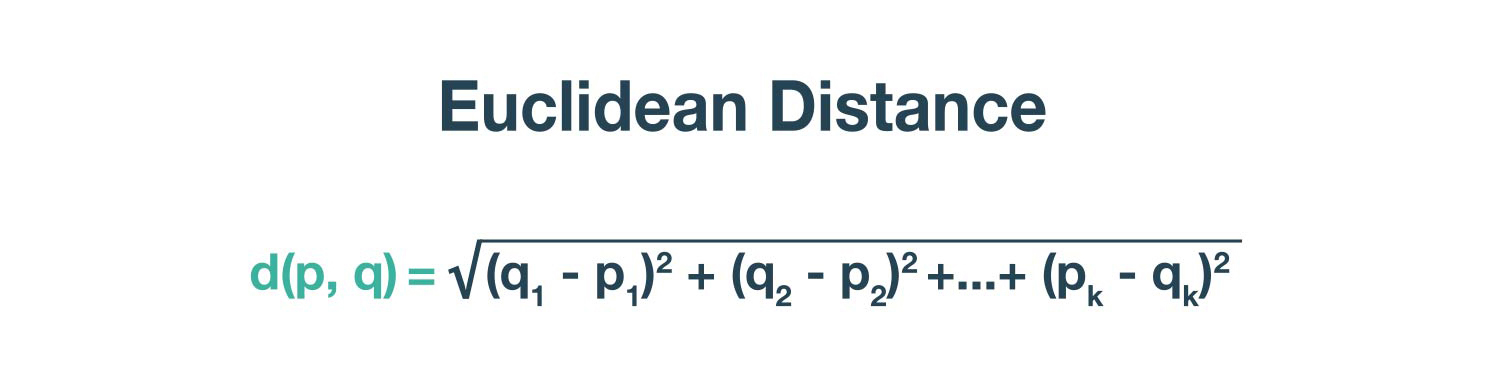
Here, p and q are the two points and p1, q1, is the x-co-ordinate, p2, q2 is the y-co-ordinate and so on.
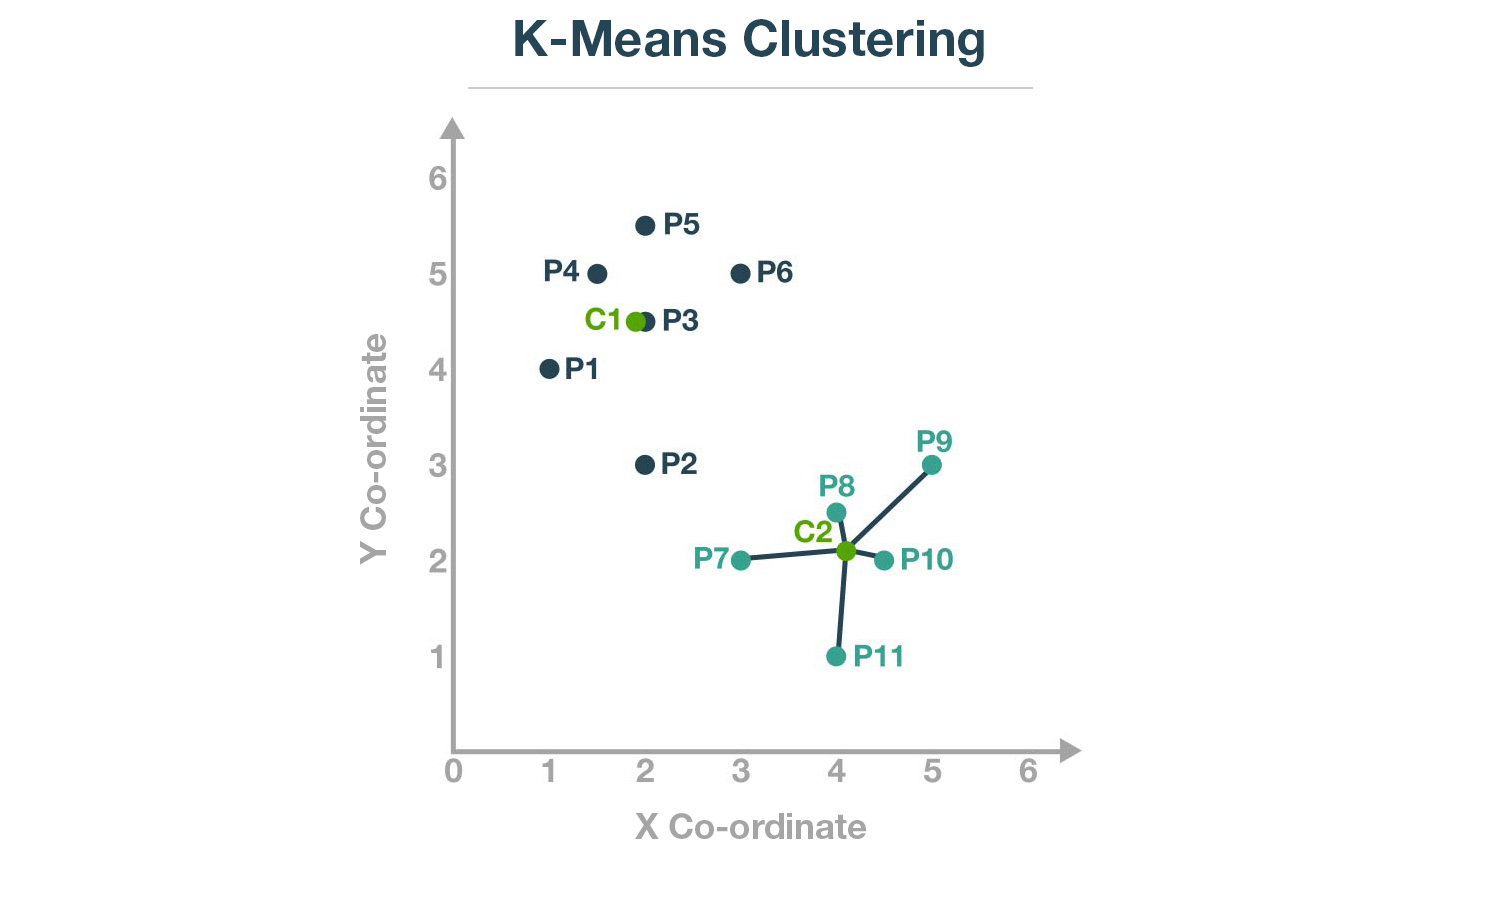
Let us take an example of two clusters and their centroids C1 and C2, as shown below:
We saw that one of the properties of a cluster is that the points within a cluster should be closer to the centroid.
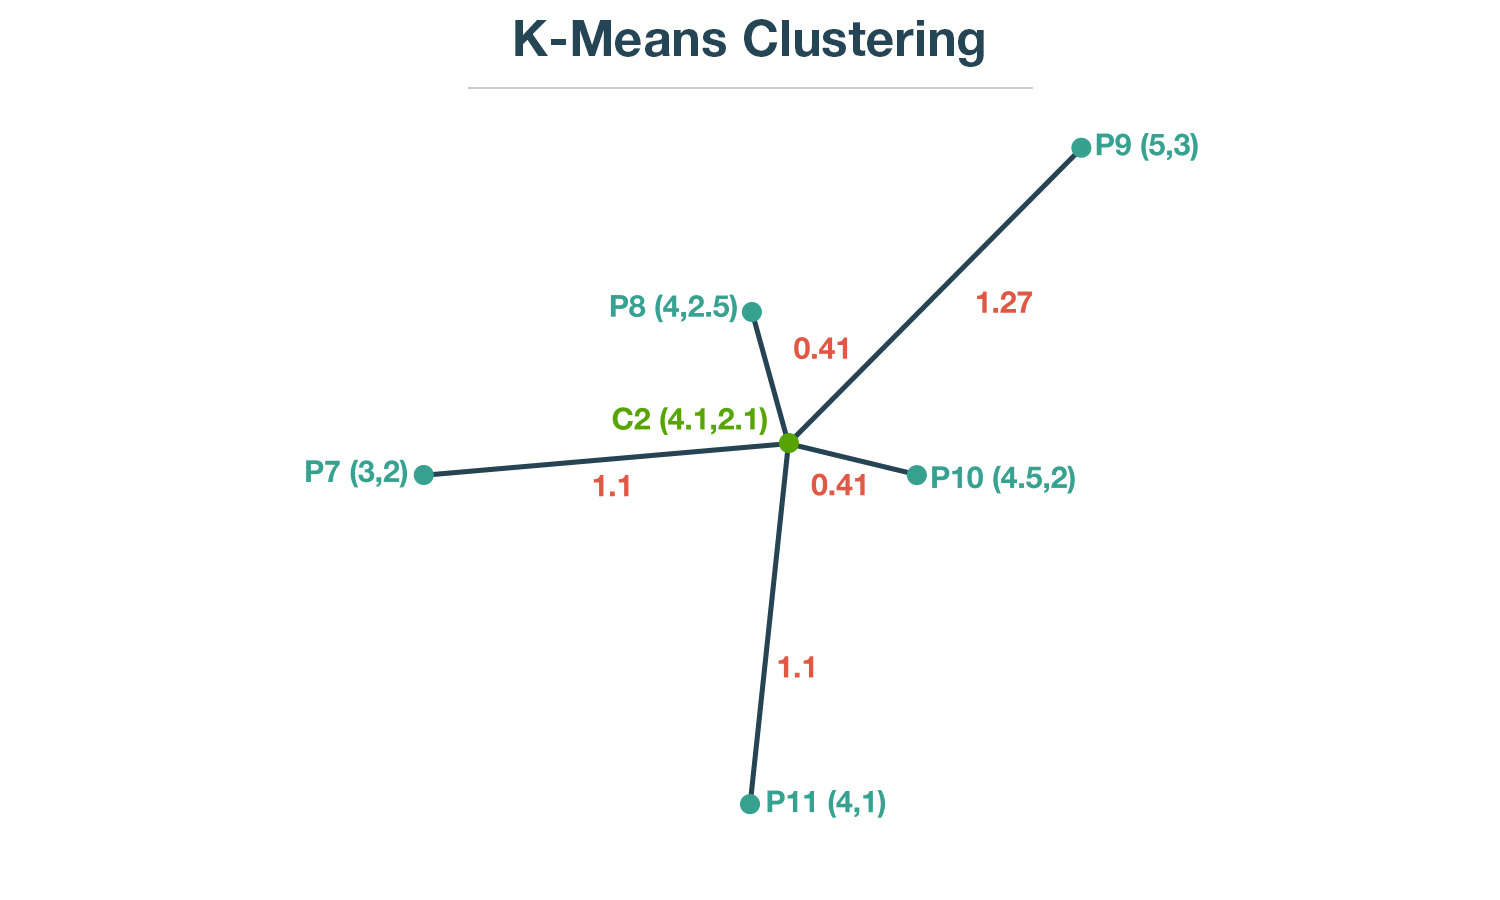
You can easily calculate the distance between each point and its centroid C2, using the Euclidean distance formula.
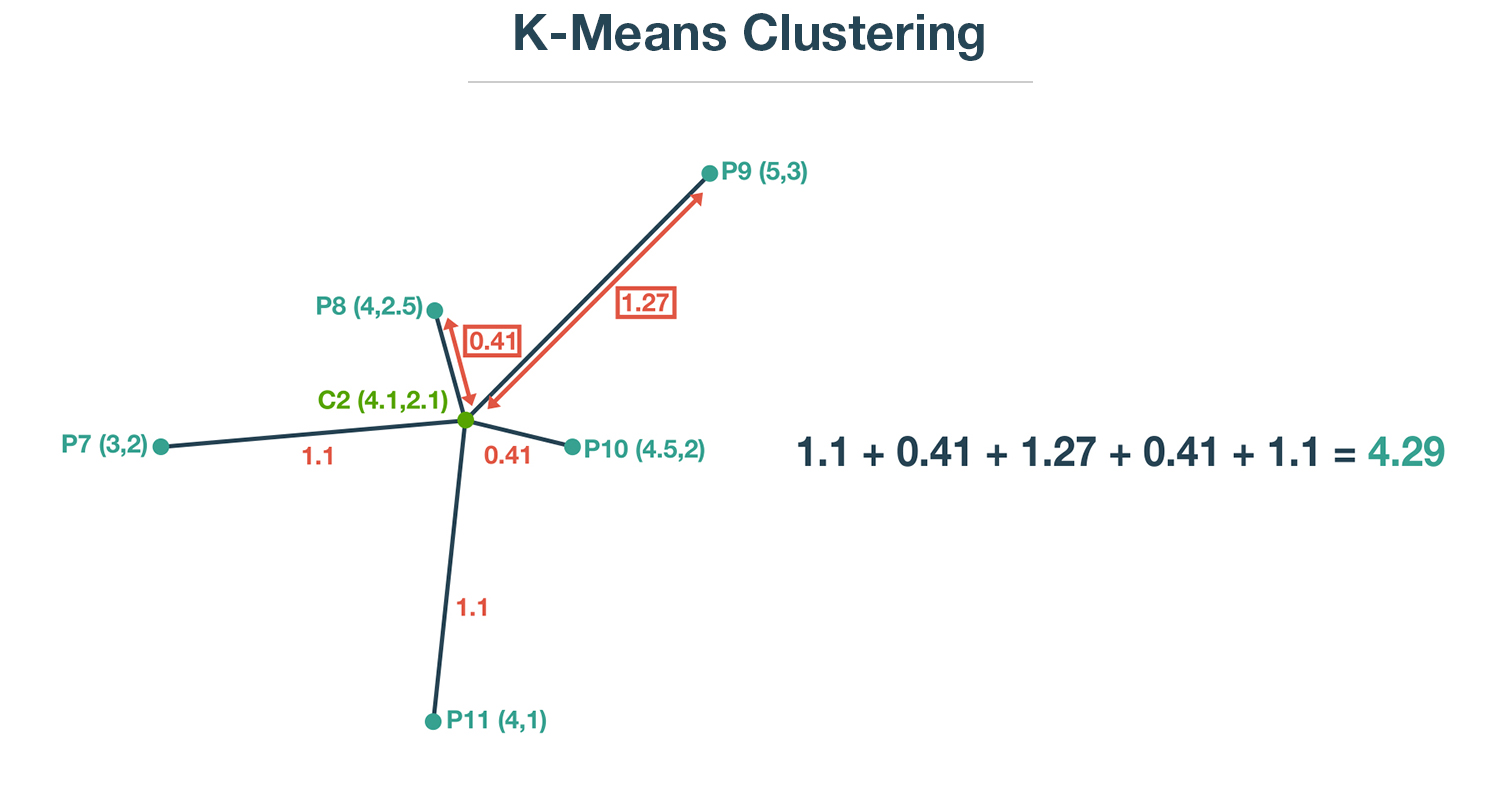
1.1 + 0.41 + 1.27 + 0.41 + 1.1 = 4.29
That value comes out as 4.29.
This will help us understand how close the points are to the centroid.
We also want to penalise the point which is further from the centroid, as compared to a relatively closer point.
For example, we want to penalise the point which is at a distance of 1.27 more, as compared to a point which is at a distance of 0.41 from the centroid.
To do this, we will take the square of the distances.
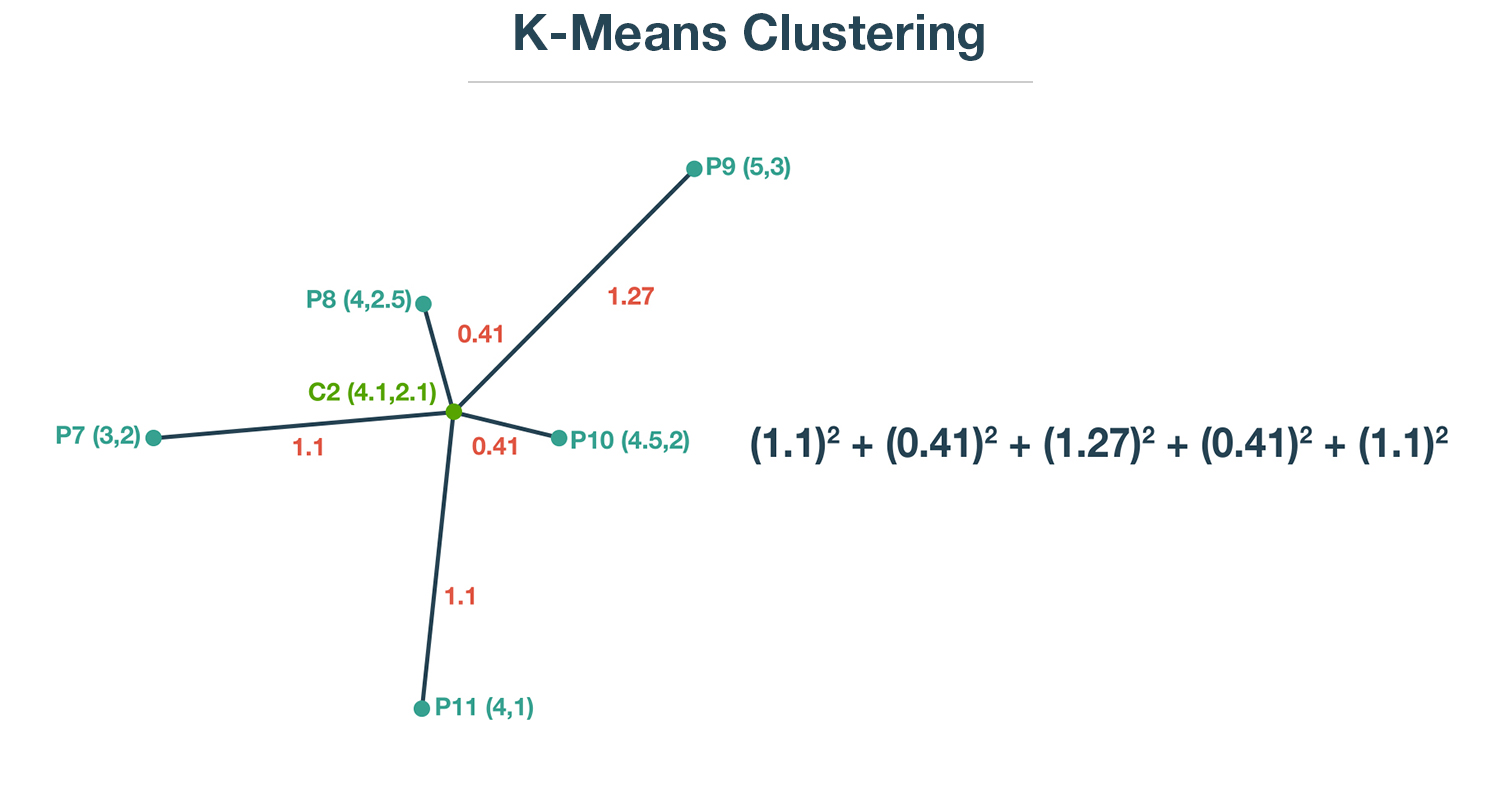
(1.1)2 +(0.41)2 +(1.27)2 +(0.41)2 +(1.1)2 = 4.37
Squaring these distances and adding them up, we get a value of 4.37.
This value is known as within-cluster-sum-of-squares or WCSS.
It is also referred to as inertia.
Performing a similar exercise for cluster 1, we get the WCSS as 6.20.
WCSS = 4.37 + 6.20 = 10.57
Therefore, we get a total of 10.57 as WCSS for the two clusters.
As per the property of clusters, our aim is to minimise this WCSS value.
How can you minimise the WCSS value?
You can minimise the WCSS value by creating more clusters.
With 3 clusters, the WCSS reduces from 10.57 to 7.06.
|
Number of Clusters |
WCSS |
|
2 |
4.37 + 6.20 = 10.57 |
|
3 |
1.7 + 4.36 + 1.0 = 7.06 |

Clearly, 3 clusters are better than 2!
Does that mean that we should keep on increasing the number of clusters till we get WCSS equal to 0?
No!
WCSS can become 0 but that will happen only when the number of clusters is equal to the number of data points.
This would be a poor situation to be in since we didn’t really create any groups with similar patterns.
Therefore, there is a tradeoff between selecting the number of clusters and minimising the WCSS.
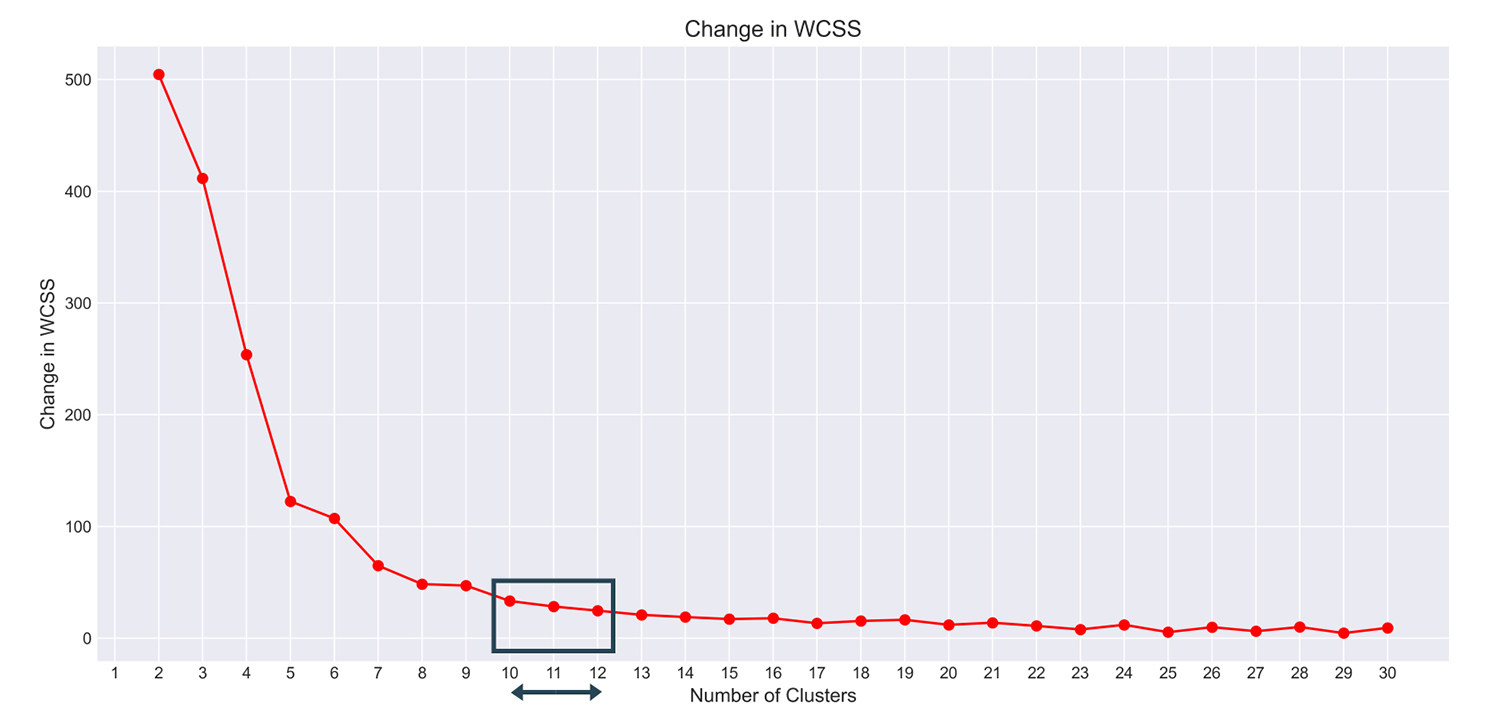
Let us calculate the WCSS for the clusters ranging from 1 to 30.
This is plotted on the graph.
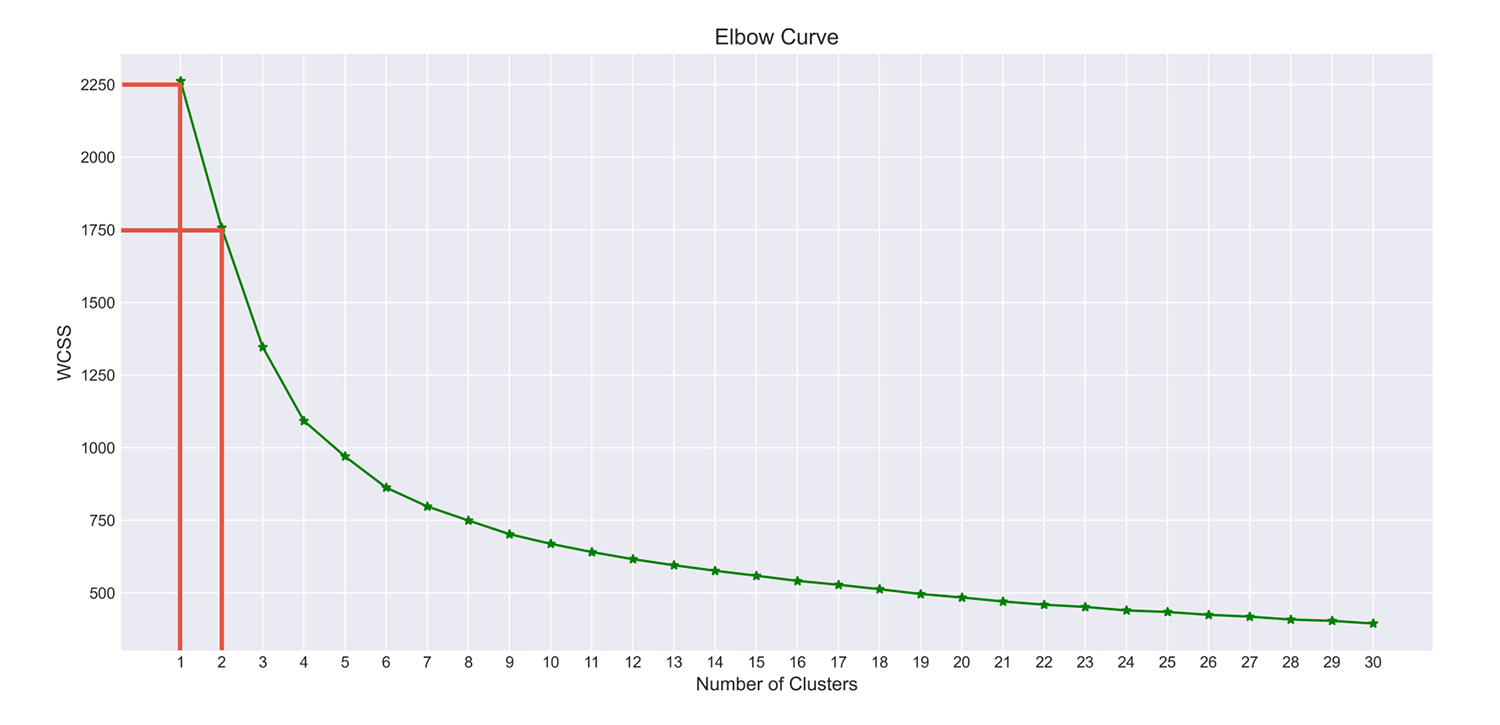
The WCSS for 1 cluster is 2250, for 2 clusters is 1750, and so on.
This graph is called an elbow curve.
You can observe that when you increased the number of clusters from 1 to 2, the WCSS declined by approximately 500 units.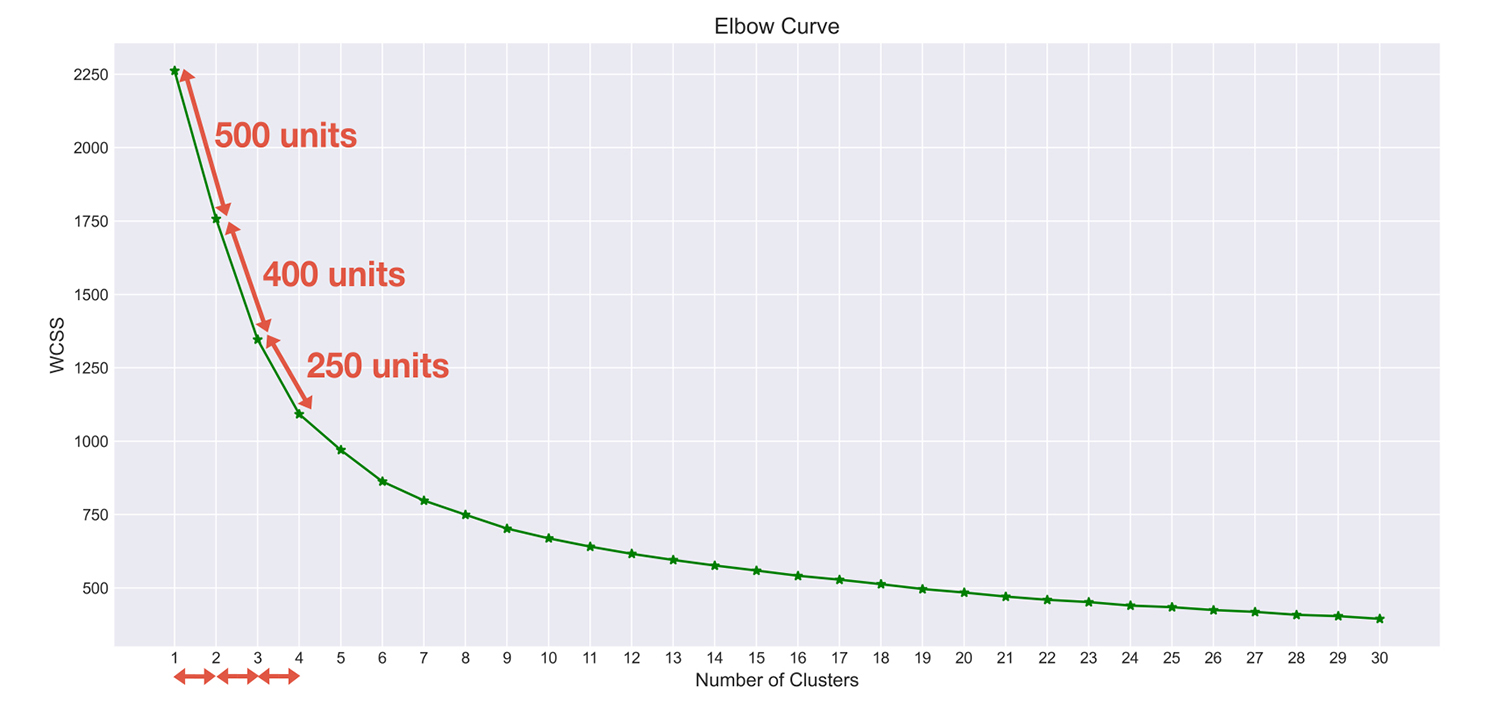
The WCSS was decreasing for each additional cluster but by a smaller amount.
Because of this, you can’t decide the tradeoff between the decrease in WCSS and the number of clusters. To get out of this dilemma, you can plot the quantum of decline in WCSS for each additional cluster that was added.
That is, moving from cluster 1 to 2, there was a decline of 500.
You plot 500 and similarly create this full graph.
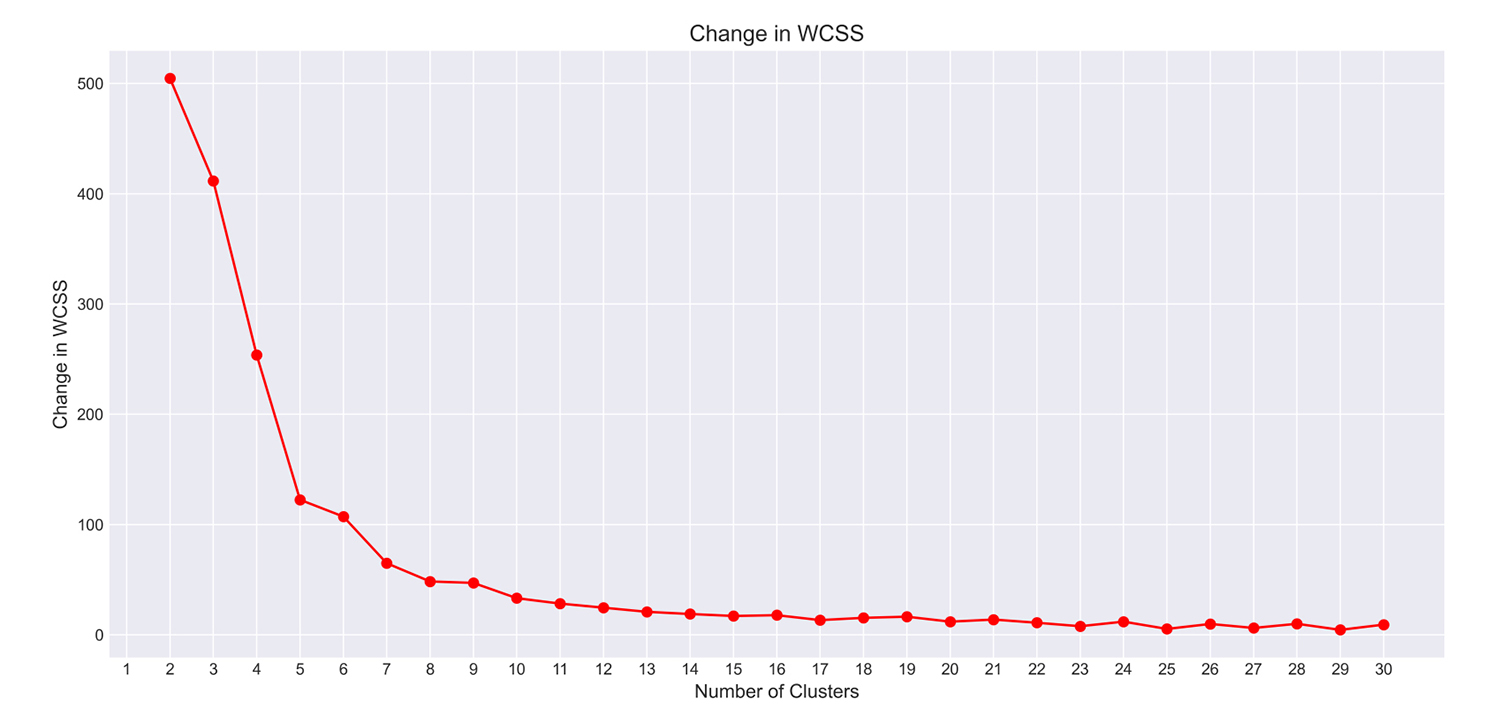
You can see that between 10 to 12 clusters, the decline in WCSS becomes almost constant.
Each additional cluster improved the results only marginally.
You can then decide to go with 11 clusters for this model.
Another reason why you can choose 11 clusters is that you should also consider overfitting.
If you went ahead with 20 or 30 clusters, you would benefit in terms of WCSS, but also at the cost of overfitting the points.
Do you want to work with real-life data and find the optimal number of clusters for the K-Means algorithm? Head to this unit and find out.
What to do next?
- Go to this course
- Click on
- Run the codes in the course

Drop us your comments and queries on the community


