Forecasting Volatility using GARCH
Being able to forecast future volatility is probably one of the most valuable skills a trader can have. But what if I told you that you don't need a sixth sense to predict volatility? You can simply use a time-series model! In today’s lesson, you will learn how to forecast the volatility of the S&P500 using the GARCH model.

All the concepts covered in this post are taken from the Quantra course Financial Time Series Analysis for Trading.
Note: The links in this tutorial will be accessible only after logging into quantra.quantinsti.com
Note that backtesting results do not guarantee future performance. The presented results are intended solely for educational purposes and should not be interpreted as investment advice.
In this post, we will cover the following topics:
- What is a time-series? And how can we forecast time-series?
- The challenge of predicting S&P500 volatility
- The ARCH model: A good start
- The GARCH model: The next level
- The predicted vs actual volatility of S&P500
- Where to go from here?
The practical implementation of forecasting S&P500 volatility using GARCH is done using Python, therefore, if you’re new to Python then you’ll find the free course on Python for Trading: Basic quite helpful.
What is a time-series? And how can we forecast time-series?
Time-series refers to a series of data points indexed in time order. For example, the price series of the S&P 500 is a time-series. Time-series forecasting involves predicting future values based on previously observed values.
So how can we forecast time-series?
Here are some models that are built for just that:
- ARMA (Autoregressive Moving Average): The ARMA model combines two components i.e., the Autoregressive (AR) part, which predicts future values based on past values, and the Moving Average (MA) part, which models the relationship of the current value with past error terms.
- ARIMA (Autoregressive Integrated Moving Average): The ARIMA model extends ARMA by adding an integration (I) component, which involves differencing the data to achieve stationarity, making it suitable for non-stationary time-series data.
- SARIMA (Seasonal ARIMA): The SARIMA model further extends ARIMA by including seasonal components to capture seasonal patterns in the data, making it effective for time-series with seasonal fluctuations.
Now, as you can see, we’ve got multiple models like ARMA, ARIMA, and SARIMA models for time-series forecasting. But, these models assume that volatility is range-bound, when in reality – that’s not always the case.
The challenge of predicting S&P500 volatility
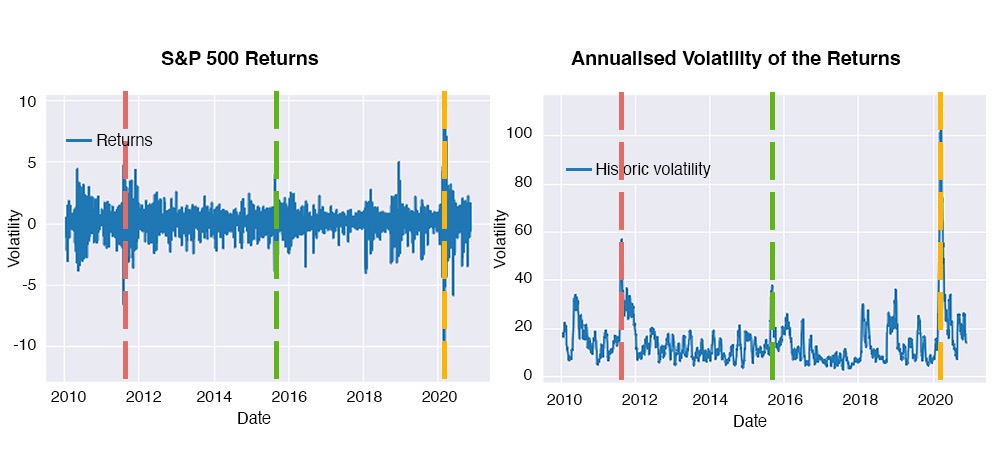
Picture this: The S&P500 returns seem to hover around a stable mean most of the time. But, every now and then, the returns swing away from the mean more than usual, hinting at increased uncertainty on those days. Increased uncertainty equals higher volatility. If you plot the annualised volatility of these returns, you'll notice it isn't range-bound; it spikes whenever the returns spike.
So in such cases, models like ARMA, ARIMA, and SARIMA would be unsuitable for predicting the S&P500 volatility. So, how do we solve this puzzle?
The ARCH model: A good start
ARCH (Autoregressive Conditional Heteroskedasticity) models are designed to handle non-constant volatility. They can predict volatility based on past data, which is useful in many market conditions. But here's the catch: any adverse market event leaves a lasting impact. Market participants take varying amounts of time to digest these events, leading to fluctuating returns that eventually stabilise.
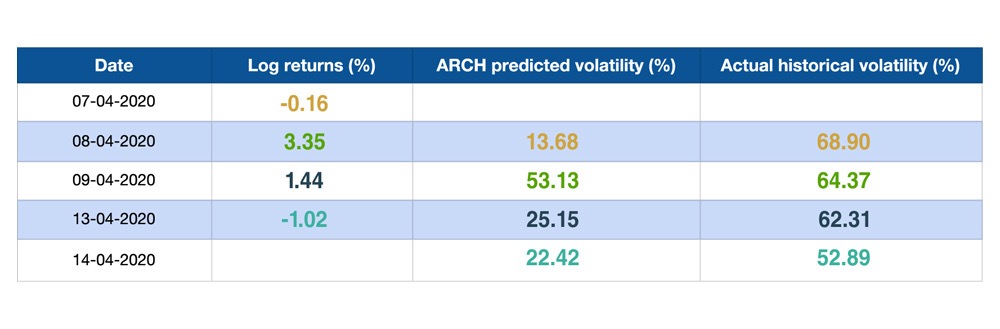
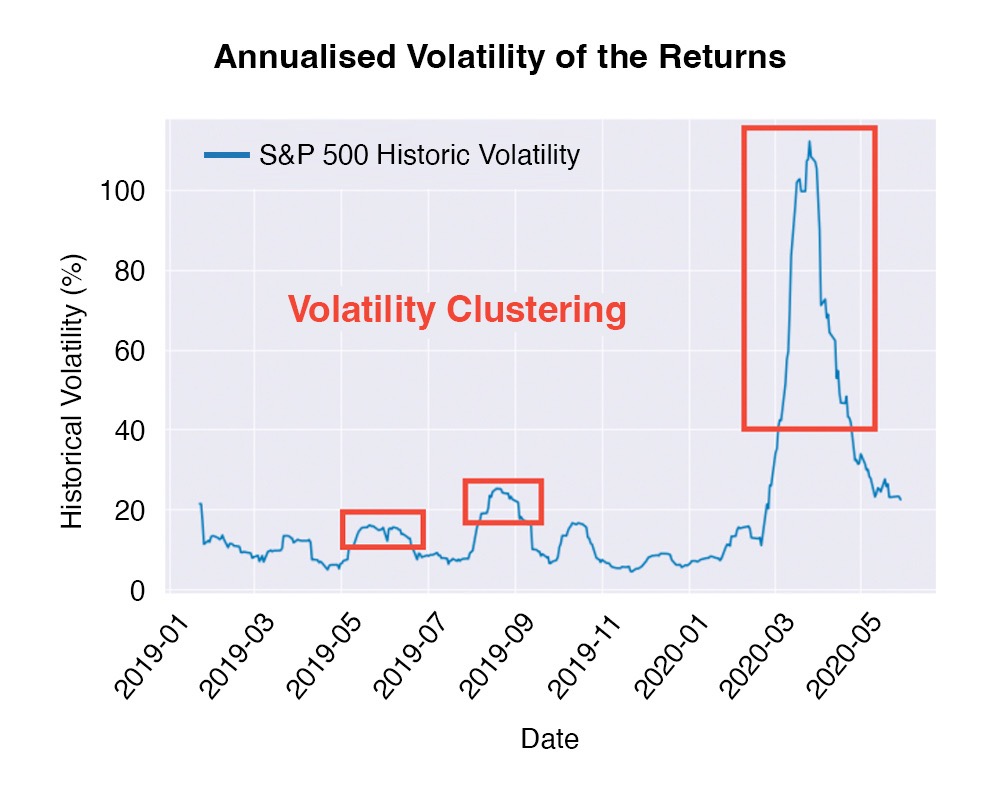
Consider the second week of April 2020, during the COVID pandemic. The market was gradually digesting the pandemic's impact, and volatility was reducing. On April 7th, the ARCH model predicted a 13.68% volatility for the next day, but the actual historical volatility was a whopping 68.90%! The ARCH model's predictions were far off because it relied solely on current returns, missing the slow reduction in uncertainty. This phenomenon is known as volatility clustering: periods of high volatility tend to follow periods of high volatility.
The GARCH model: The next level
So, how do we address this volatility clustering problem? The solution lies in the improved ARCH model, known as GARCH (Generalized Autoregressive Conditional Heteroskedasticity). Developed in 1986, the GARCH model captures volatility clusters by incorporating not just past returns but also past volatility into its predictions.
Mathematically, the GARCH model predicts the variance at the next time step as a constant term plus a coefficient times the squared returns at the current time step, plus another coefficient times the variance at the current time step. The formula for GARCH is shown below:

Where:

This approach ensures that the model accounts for both recent returns and ongoing volatility, providing more accurate predictions.
You can estimate the constant and coefficients in the GARCH equation by fitting the model to historical data. This improvement makes the GARCH model a powerful tool for predicting series with changing volatility, like the S&P500 returns.
The predicted vs actual volatility of S&P500
The results of the forecast (prediction in green vs actual in blue) using GARCH model is shown below:
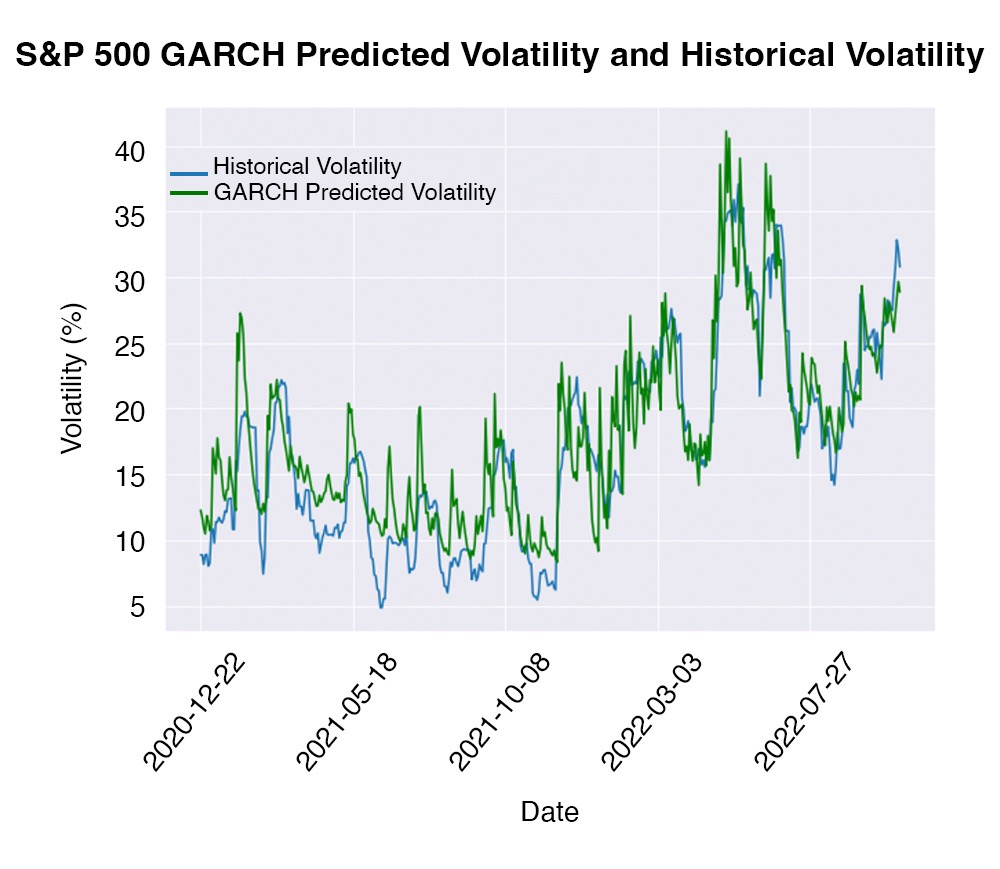
As you can see, the model did a decent job at predicting the volatility of S&P500, especially in the recent years. Let’s see how accurate it was around the March-2020 crash:
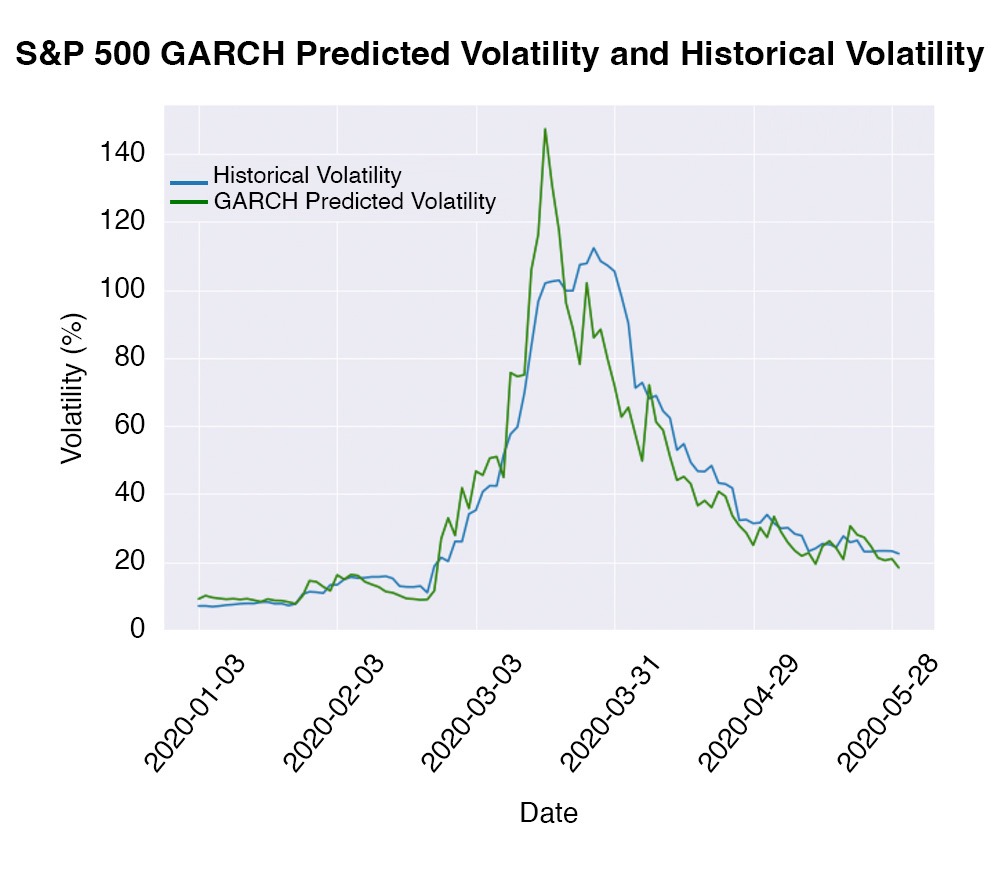
It isn’t spot on but it has done a fairly good job and is observed to be more accurate than the predictions of the ARCH model for the same time period (as seen earlier).
The GARCH model is a powerful tool which is designed to help you better understand and anticipate market fluctuations. As mentioned earlier, we have forecasted volatility of S&P500 using GARCH with the help of Python. The Python implementation for this part has been covered in Section 25 Unit 4 of this course.
Where to go from here?
The GARCH model is specifically designed to predict future volatility by considering both past returns and past volatility. Using this model will help you anticipate changes in future volatility. But what do you do after forecasting volatility? Well, on the basis of the predicted volatility you can decide on when to go long and when to go short on volatility. The Financial Time Series Analysis for Trading course on Quantra covers a strategy that uses GARCH predicted volatility to trade the VXX ETN. All with the help of Python!

What to do next?
- Go to this course
- Click on
- Go through 10-15% of course content
- Drop us your comments and queries on the community

IMPORTANT DISCLAIMER: This email is for educational purposes only and is not a solicitation or recommendation to buy or sell any securities. Investing in financial markets involves risks and you should seek the advice of a licensed financial advisor before making any investment decisions. Your investment decisions are solely your responsibility. The information provided is based on publicly available data and our own analysis, and we do not guarantee its accuracy or completeness. By no means is this communication sent as the licensed equity analysts or financial advisors and it should not be construed as professional advice or a recommendation to buy or sell any securities or any other kind of asset.


