Decision Trees
Here, we're exploring the fascinating world of decision trees in machine learning. These trees are a simple yet effective technique that can help us make decisions, particularly when it comes to stock trading.
Have you ever found yourself looking at stock prices and wondering if it's the right moment to buy or sell?
If you have answered, “Absolutely!” then you are in luck, as decision trees can actually assist us in determining whether it's a suitable time to buy or exit a stock position. It's quite amazing, isn't it?
That sounds intriguing! So, can we actually create a trading strategy based on decision trees?
Yes, indeed!
However, it's important to note that while decision tree forecasts can be helpful, they may not always be accurate. To ensure their effectiveness, proper backtesting is required. It's also essential to keep in mind that decision trees may not guarantee positive returns all the time.
In our decision trees for trading course, we applied the decision tree ML model framework to Tesla's share price and conducted backtesting. The cumulative returns of this backtesting are displayed below.

You can see that for a few months, there are no trades taken, and hence, a flat line in the returns graph for a few months and then a sudden spike. The flat line indicates that the decision tree did not give any signal in that period. This shows that while you received positive returns for the period between July 2022 to July 2023, the returns are not gradual. It is important to note that backtesting results do not guarantee future performance. The presented strategy results are intended solely for educational purposes and should not be interpreted as investment advice. A comprehensive evaluation of the strategy across multiple parameters is necessary to assess its effectiveness.

All the concepts covered in this tutorial are taken from the Quantra course on Decision Trees in Trading. You can preview the concepts taught in this course by clicking on the free preview button.
Note: The links in this tutorial will be accessible only after logging into quantra.quantinsti.com
Why use a decision tree model?
You might think that alright, this sounds like it is worth exploring, but what in the world is a decision tree, and does it yield any fruits?
Fruits - not really, informed decisions - absolutely!
What does that mean?
Imagine you are a technical analyst, and lately, you have taken a liking to the RSI indicator. You know that if the RSI of the stock goes below 30, you will buy. And above 70, you will sell. Life is good because the majority of the time, you are winning!

But in the next week, the majority of your trades turned out to be loss-making ones.

You sigh and think, should I pick another indicator? Then your colleagues tell you to try ADX and SMA. For their sake, you download the data for the last six years of Tesla Inc., calculate the indicator values, and see the data as follows.
|
Date |
OPEN |
HIGH |
LOW |
CLOSE |
ADX |
RSI |
SMA |
|
21-03-2018 |
20.683 |
21.496 |
20.679 |
21.102 |
14.114 |
47.619 |
22.225 |
|
22-03-2018 |
20.926 |
21.255 |
20.545 |
20.607 |
13.269 |
43.453 |
22.101 |
|
: |
: |
: |
: |
: |
: |
: |
: |
|
27-06-2023 |
243.240 |
250.390 |
240.850 |
250.210 |
46.758 |
60.649 |
239.874 |
|
28-06-2023 |
249.700 |
259.880 |
248.890 |
256.240 |
45.725 |
63.102 |
242.628 |
You will then try to come up with rules based on these indicators, on when to buy or sell.
For example, you will buy when:
- ADX > 25
- RSI < 40
- SMA < CLOSE
And sell or no position when it doesn’t meet this criteria.
But you wonder if these are the right rules. You have heard traders buying even when RSI > 60!
Frustrated, you wonder if there is a different way to arrive at a decision.
How does it work?
Now, you have heard about those fancy machine learning algorithms, where you just give all the data you have and the ML model simply gives you an answer, buy or not buy!
Well, you can do this with decision trees!

This doesn’t seem right. How would the decision tree know when to buy? Does magic really exist!
Ok, decision trees are not that straight forward. Let’s take a small detour and understand how you, a human, might learn when to buy or sell.
Let’s assume, you don’t know at what value of RSI should you buy.
So everyday you calculate the RSI value, and then you wait and see whether the stock price rose the next day, or not.
For 5 days, you keep a record in a table, which is shown below.
|
Date |
RSI |
Did Stock Rise Next Day? |
|
9-07-2023 |
42 |
Yes |
|
10-07-2023 |
41 |
Yes |
|
11-07-2023 |
45 |
Yes |
|
12-07-2023 |
42 |
Yes |
|
13-07-2023 |
39 |
No |
Based on the limited data, you learn that if RSI is above 40, the stock rises the next day. If it goes below 40, the stock price declines.
This is exactly how a decision tree learns!

In short, you will first give a part of data to the decision tree, say, the indicator values, and another column, which is the answer. Here, the answer is “Whether the stock price rises the next day? The answer is in the format of “Yes” or “No”.
This data is called the “training data” because this data is used to train the decision tree!
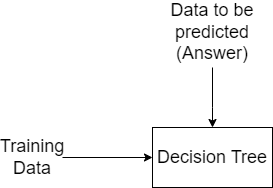
For this example, you will give the indicator values, i.e., RSI, ADX, and SMA values for each day. These indicator values are called features. And the answer, i.e., “Whether stock will rise the next day?” as a separate column. This answer column is called the ‘target variable’. Instead of Yes or No, you will say 1, for signifying the stock rose, and 0, for the stock did not rise.
|
Features |
Target Variable |
|||
|
Date |
ADX |
RSI |
SMA |
Did stock rise the next day |
|
21-03-2018 |
14.114 |
47.619 |
22.225 |
1 |
|
22-03-2018 |
13.269 |
43.453 |
22.101 |
1 |
|
: |
: |
: |
: |
: |
|
28-06-2021 |
46.758 |
60.649 |
239.874 |
0 |
|
29-06-2021 |
45.725 |
63.102 |
242.628 |
1 |
What is the ‘tree’ part of the decision tree?
Have you ever gone to the supermarket to buy food items? You must have a decision-making flowchart which you use to decide to buy. Assume you are going to buy bread. You look at the bread aisle and there are multiple options available. So you decide to buy brown bread. Still so many options!
You then look at the weight and say you want only 400 gms. Two choices left!
So you buy the cheaper quality one!
This can be shown in a flow chart as follows:

In a similar manner, the decision tree is trained on the training data and creates a flowchart structure and keeps going down the branches till it has considered all the features and arrived at the right (or wrong) answer.

As you can see in this flowchart, the decision tree realised that the RSI indicator has a better ability to predict the next day's price. So it will first check the RSI indicator’s value. Then it will go to the next branch.
Like we learn by observations, the decision tree uses a concept called gini index to select the correct value at which it should divide the data points and move towards the next level of the tree.
The values at the end show the number of variables which belong to the target class 0, and 1.
Based on the value for the day, it will decide on which branch to go next.
If the RSI value for the day was 50, the decision tree would go to the left part of the tree, and so on.
There, that’s it! The decision tree has learned! The machine is now enlightened!
Implementation
Remember how we had said that we gave part of the data for training? The reason for not giving the entire dataset to the ML decision tree algorithm is so that we can test it later.
Once the decision tree has been trained, you will give the decision tree the final part of the data, the data which it has never seen before. And you will ask the decision tree to predict the target variable now. In our case, the target is 1, if the decision tree algorithm thinks that the stock price will rise the next day. Or 0, indicating the prediction of the stock price not rising.
For this example, you gave 80% of the dataset for training, and 20% for testing.
Based on the training, the decision tree predicted the following.
|
Features |
Target |
Prediction by Decision Tree |
|||
|
Date |
ADX |
RSI |
SMA |
Prediction if stock will rise next day |
Did stock rise next day |
|
21-07-2022 |
10.62 |
66.13 |
239.34 |
1 |
1 |
|
22-07-2022 |
12.28 |
66.33 |
241.20 |
1 |
0 |
|
25-07-2022 |
13.48 |
63.53 |
242.34 |
1 |
0 |
|
26-07-2022 |
13.57 |
57.03 |
243.03 |
1 |
1 |
|
27-07-2022 |
14.17 |
63.70 |
245.14 |
1 |
1 |
|
28-07-2022 |
15.14 |
65.87 |
247.76 |
1 |
1 |
|
29-07-2022 |
16.74 |
70.89 |
251.39 |
1 |
1 |
|
01-08-2022 |
18.76 |
70.93 |
254.90 |
1 |
1 |
|
: |
: |
: |
: |
: |
: |
You can see that the decision tree is not right all the time.
All right! We have the predicted signals, how do I use it to buy or sell the stock?
Ah! Let us create a long-only strategy with the following entry and exit rules.
Entry rule: Buy when the predicted signal is 1.
Exit rule: Sell when the predicted signal is 0.
According to the entry or exit rule, we calculate the strategy return and plot the cumulative returns as shown below.
Remember that this is only for the test dataset, as this dataset has never been seen before by the decision tree. Of course, since it is a machine learning algorithm, you can also check its analytics like accuracy, precision, and recall!
You will find the python code and the analytics in the notebook at the following link. Remember that you will have to get a free preview of the course and go to Section 3 Unit 9 to access this notebook.
Go ahead and try it. Also, try to add different features and see if the strategy performance improves or not! It is important to note that backtesting results do not guarantee future performance. The presented strategy results are intended solely for educational purposes and should not be interpreted as investment advice. A comprehensive evaluation of the strategy across multiple parameters is necessary to assess its effectiveness.
Of course, we used the decision tree for classifying whether the price will increase or decrease. These are two classes, 0 or 1. You can also try to predict the next day’s price as well, which is called regression in this case. You can enrol in the course and find out more about it.
What to do next?
- Go to this course
- Click on
- Go through 10-15% of course content
- Drop us your comments and queries on the community

IMPORTANT DISCLAIMER: This email is for educational purposes only and is not a solicitation or recommendation to buy or sell any securities. Investing in financial markets involves risks and you should seek the advice of a licensed financial advisor before making any investment decisions. Your investment decisions are solely your responsibility. The information provided is based on publicly available data and our own analysis, and we do not guarantee its accuracy or completeness. By no means is this communication sent as the licensed equity analysts or financial advisors and it should not be construed as professional advice or a recommendation to buy or sell any securities or any other kind of asset.


