Options Trading: How to Calculate the Probability of Profit?
Have you ever wondered what guides traders in the complex world of options trading?
Meet "Probability of Profit," or "POP." It's a useful tool that estimates how likely a trade is to make money. But what exactly is POP, and why does it matter? Let's delve into POP and understand its role in options trading.
Welcome to the world of POP, where probability helps inform trading decisions.
All the concepts covered in this post are taken from the Quantra course on Systematic Options Trading. You can preview the concepts taught in this course by clicking on the free preview button and going to Sections 10 and 11 of the course.
Note: The links in this tutorial will be accessible only after logging into quantra.quantinsti.com


The following is covered in this Quantra Classroom
- What Is the Probability of Profit (POP)?
- What Is the Need for POP?
- How to Calculate the POP for Options Trading?
- Implementation of empirical distribution method to calculate POP
What Is the Probability of Profit (POP)?
In options trading, the metric probability of profit represents the likelihood that a particular options trade will be profitable at expiration based on current market conditions and the parameters of the trade.
Traders often use POP as a metric to evaluate the potential success of their options strategies. It's calculated based on various factors including the strike price, expiration date, underlying asset price, implied volatility, and other market-related variables.
What Is the Need for Probability of Profit?
POP aids traders in evaluating the success likelihood of their options strategies, facilitating informed decisions on risk assessment, position sizing, and capital allocation.
It enables strategy comparison and selection aligned with traders' risk tolerance and objectives. Moreover, POP guides trade adjustments, empowering traders to make timely decisions to limit losses based on probability assessments.
To learn more about the need for calculating the probability of profit with an example, check this video in the course ‘Systematic Options Trading’.
How to Calculate the Probability of Profit for Options Trading?
The probability of profit can be found by using the ‘empirical distribution’ method. In this method, the underlying asset's historical data along with the time to expiry in days is used to create the distribution of the expected price at expiry.
For example, in the past data, if a price move of 10% happened 5 out of 100 times, the empirical distribution considers the probability of such movements as 5%. So, we need the historical data and time to expiry to create the empirical distribution of prices.
Let’s understand the implementation with an example.
Consider
- The time to expiry is 20 days
- Past data = 1 year
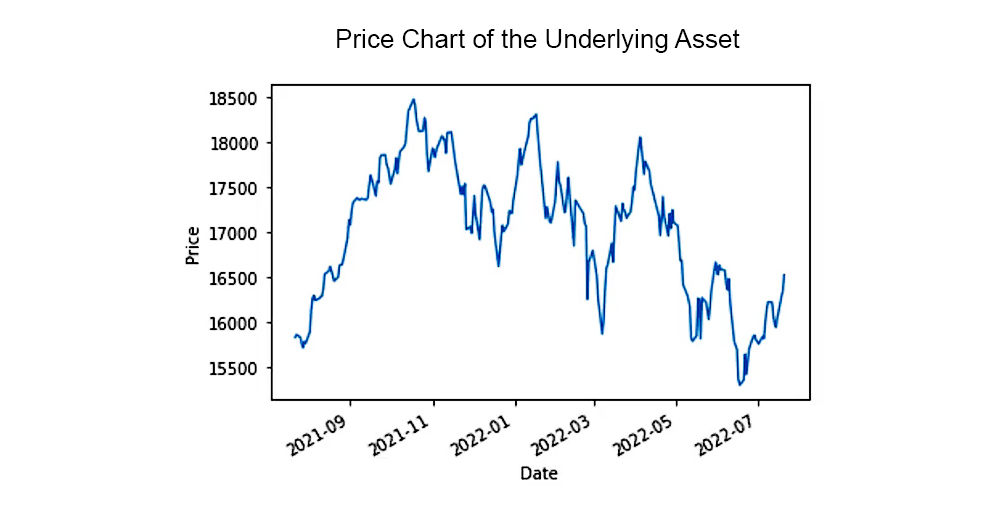
The figure ‘Price Chart of the Underlying Asset’ represents the historical prices of the underlying asset from 14th July 2021 to 14th July 2022. Using this, can you calculate the probability of the price expiring between $15950 and $16075 on the day of expiry?
Let’s find out using the empirical distribution method.
Consider, that the current date is 15th July 2022 and you want to calculate the probability of the price expiring between $15950 and $16075.
So the starting date of the past data would be 15th July 2021. Since we want to understand price probability in the next 20 days,
- Find the returns in past data from 15th July 2021 till 14th August 2021 (20 trading days) which is 4%.
- Next, find the returns in 20 days from the next day, i.e. returns from 16th July 2021 till 15th August 2021 (20 trading days) which is 4.5%.
In this manner, continue finding the rolling 20 trading days returns till the current day. This would result in a returns plot as shown below.
It is important to note that backtesting results do not guarantee future performance. The presented strategy results are intended solely for educational purposes and should not be interpreted as investment advice. A comprehensive evaluation of the strategy across multiple parameters is necessary to assess its effectiveness.
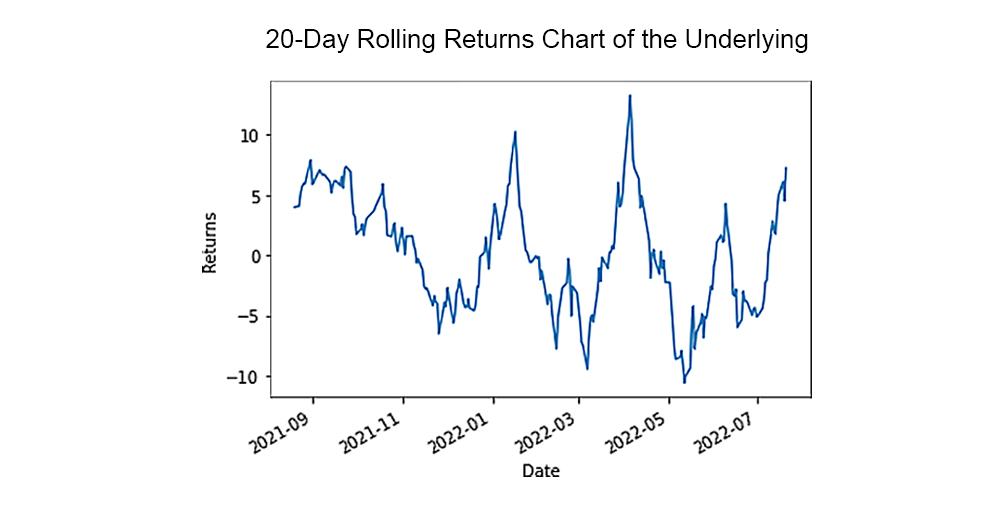
The figure '20-Day Rolling Returns Chart of the Underlying' represents the 20-day rolling returns of the underlying asset calculated from 2nd August 2021 to 14th July 2022.
Using these returns, we can find the probability of price closing in a price range during the expiry. Just multiply the returns by the last traded price of the asset to get the probability of price closing at expiry in different price levels.
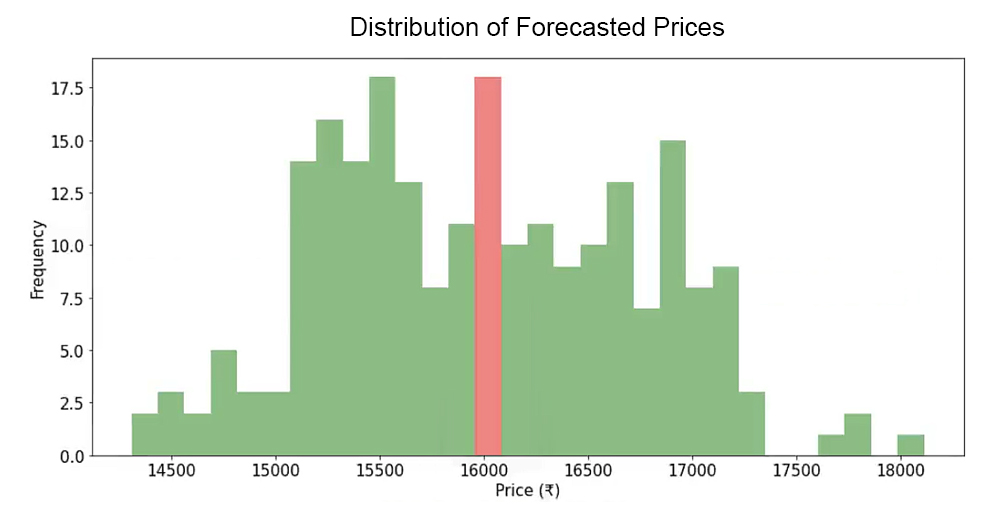
The histogram in the figure 'Distribution of Forecasted Prices' shows that, as per returns analysis of historical data, the price expiring between $15950 and $16075 (marked with a red bar of width 125) is expected 18 times.
Since we used the past 1 year of data which is 230 data points for calculating returns, the probability would be (18X100)/230 = 7.5%.
This histogram can be used to create an empirical distribution with a bar width of 125.
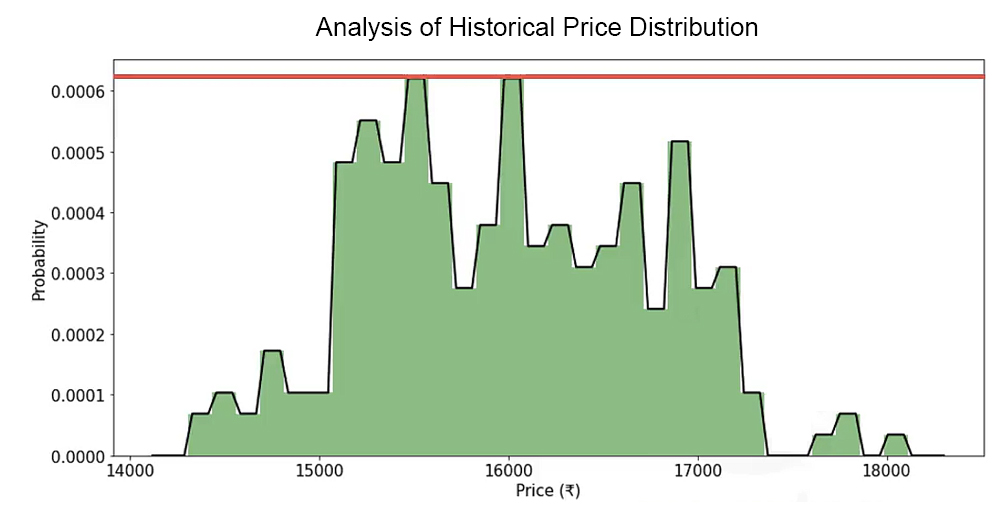
As per this empirical distribution in the figure 'Analysis of Historical Price Distribution', the probability of price closing between $15950 and $16075 is 0.00061*125 which is 7.5% (same as the probability calculated using the histogram).
So, how do we use this to find the probability of profit in an option position, say a long call position at a strike price of $16000 for a premium of 100?
Find the Cumulative Distribution Function (CDF) of the breakeven price ($16000+$100 = $16100) and subtract this value from the entire probability of the distribution (1)
Strike price = $16000
Premium = $100
Break-even = $16100
CDF(16100) = 0.56
1-0.56 = 44%
So the probability of the call option of strike $16000 closing in the money at expiry is 44%!
To summarise,
1) Calculate the rolling returns from the beginning of the past data till the current date with a rolling interval of the number of days till expiry.
2) Multiply the returns by the last traded price of the asset to get the probability of price closing at expiry in different price levels. Plot a histogram using this data.
3) This histogram can be used to create an empirical distribution which can be used to find the probability of profit in an option position.
This calculation of the probability of profit of an options strategy using empirical distribution is explained in this unit of the course Systematic Options Trading.
What to do next?
- Go to this course
- Click on "Free Preview"
- Go through 10-15% of course content
- Drop us your comments and queries on the community
IMPORTANT DISCLAIMER: This post is for educational purposes only and is not a solicitation or recommendation to buy or sell any securities. Investing in financial markets involves risks and you should seek the advice of a licensed financial advisor before making any investment decisions. Your investment decisions are solely your responsibility. The information provided is based on publicly available data and our own analysis, and we do not guarantee its accuracy or completeness. By no means is this communication sent as the licensed equity analysts or financial advisors and it should not be construed as professional advice or a recommendation to buy or sell any securities or any other kind of asset


