It looks like the moving average cross over example in the Quantra course has the legend mixed up. Blue line should be bench mark. Can someone confirm this?
I am testing NVDa between 1/1/23 and 10/27/23 at 40 and 70 day moving averages.
Thanks,
Hi Eric,
Could you please confirm if the notebook you are referring to is the "Moving Average Crossover" example from the "Getting Started with Algorithmic Trading" course? If it is indeed the same notebook, the legends in the notebook are actually correct. The blue line represents the moving average strategy.
Feel free to reach out if you have any more questions or need further assistance!
Thanks
Rushda
Yes it is the Moving Average Crossover from Getting Started with Algorithmic Trading. I believe the notebook is correct; however, I'm 99.9% sure the legends in the Blueshift implementation are not correct. The blue line follows the buy and hold pattern exactly. Were you able to see the image in my original post?
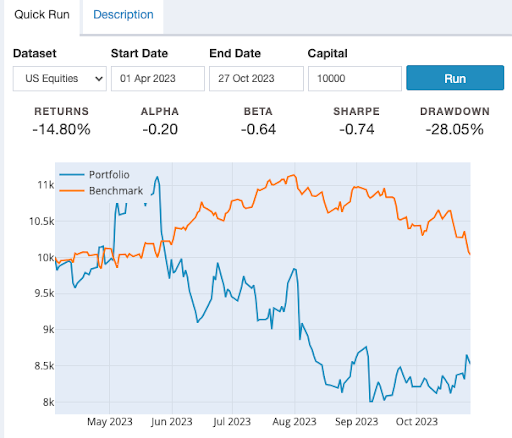
I'm actually unable to see the image in your original post. But here's a screenshot of the backtest i ran (same strategy template as the one used in "Getting Started with Algorithmic Trading"). The legends are correct, blue line depicts the moving average crossover strategy and the orange line is for the benchmark:
Hope this resolves your query